HOT TOPICS LIST
- MACD
- Fibonacci
- RSI
- Gann
- ADXR
- Stochastics
- Volume
- Triangles
- Futures
- Cycles
- Volatility
- ZIGZAG
- MESA
- Retracement
- Aroon
INDICATORS LIST
LIST OF TOPICS
PRINT THIS ARTICLE
by Koos van der Merwe
The recent terror in Russia has almost assured George Bush of re-election. His polls are up, and voters appear to be saying that the world must be rid of the scourge of terrorism, and that George Bush is the man to do it. What are the charts telling us?
Position: Accumulate
Koos van der Merwe
Has been a technical analyst since 1969, and has worked as a futures and options trader with First Financial Futures in Johannesburg, South Africa.
PRINT THIS ARTICLE
ELLIOTT WAVE
THE S&P 100 Index and GEORGE BUSH.
09/07/04 02:29:21 PMby Koos van der Merwe
The recent terror in Russia has almost assured George Bush of re-election. His polls are up, and voters appear to be saying that the world must be rid of the scourge of terrorism, and that George Bush is the man to do it. What are the charts telling us?
Position: Accumulate
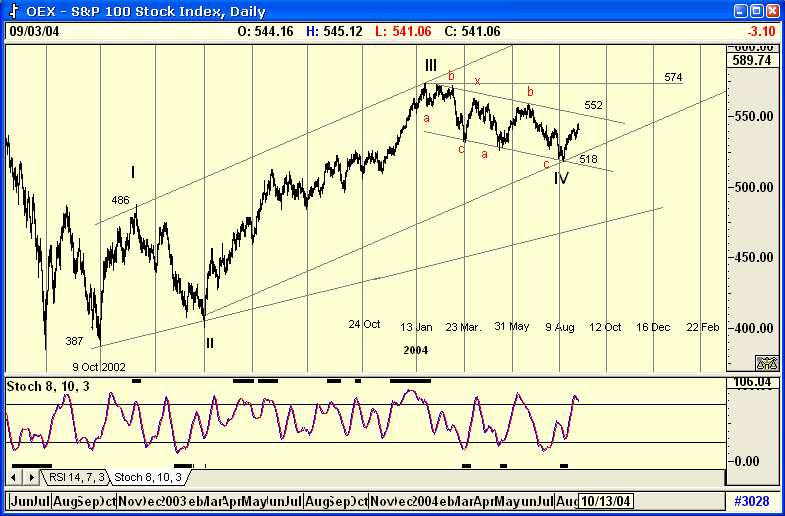
| I decided to look at the chart of the S&P 100 index to do this for me, because I believe that the S&P 500 index follows too many stocks, and the Dow, too few. The two-year chart from September 2002 to September 2004 tells us the following. a. It starts from the low of October 2002. The chart can be considered flawed, in that it is decisively bullish, whereas the second chart, a long-term monthly chart, shown below is decisively bearish. In spite of this, you must realize that the chart is suggesting a very decisive impulse wave up. The low of Wave IV is very real, bottoming on the support line drawn parallel to the resistance line I - III. This then suggests that Wave V should be above 574. Wave theory suggests that Wave V should equal Wave I, which would place Wave V at 617. (486 - 387 = 99 + 518 = 617) b. Cycles are suggesting a cyclical low on October 12th. This could be on a lackadaisical September, as September is notorious for being a dull market. You can almost use the high as a trend indicator, in that a high close to August 9th, would be bearish, while one close to October 12th will be bullish. A high at midpoint, that is a date midway between the two cycle lows, will suggest a sideways moving market. c. My indicator of choice, a stochastic 8,10,3, is suggesting that the index is overbought, possibly trending down.  Figure 1: Daily chart for OEX. |
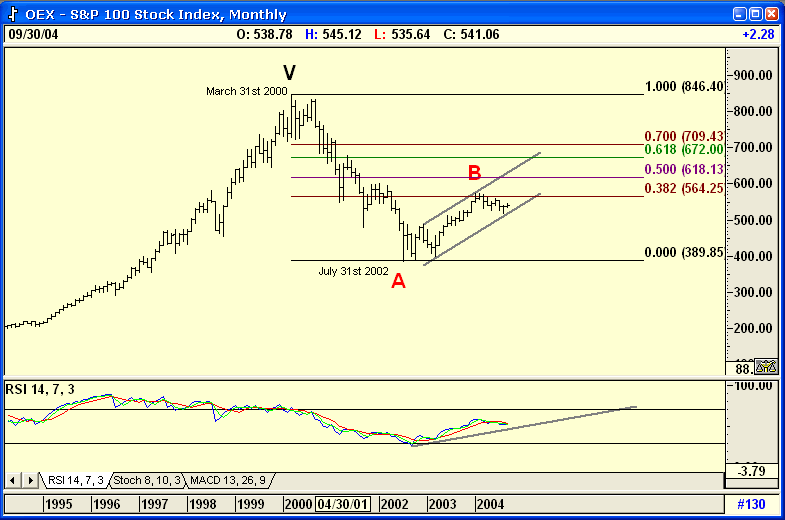
| THE MONTHLY CHART I have kept the chart simple so that I may show the Fibonocci ratios and argue in their favor. The chart follows the preferred count and ABC retracement from WAVE V on March 31, 2002. The Index then fell, in what I believe to be a Wave A, to the low of 389.85 on July 31, 2002. From this level it should now retrace a Wave B upwards to any one of the Fibonocci levels shown. At the moment it has found resistance at the 38.2% level of 564.25. The question whether this level will hold or if it will break through it and test the 50% level at 618.53 before falling into Wave C. The rising RSI indicator suggests the latter, as does the daily chart. |

|
| Figure 2: The S&P100 Index weekly chart. |
| Graphic provided by: AdvancedGET. |
| |
| CONCLUSION Should the Index fail to reach the 617 level, then the entire count could change to a short-term bearish count. Do note that Wave V of the daily chart at 617 is the 50% Fibonocci retracement level of the monthly chart. From this I must conclude that the short-term trend is up, and that the market approves of the re-election of George Bush as President of the United States of America. |
Has been a technical analyst since 1969, and has worked as a futures and options trader with First Financial Futures in Johannesburg, South Africa.
| Address: | 3256 West 24th Ave |
| Vancouver, BC | |
| Phone # for sales: | 6042634214 |
| E-mail address: | petroosp@gmail.com |
Click here for more information about our publications!
Comments
Date: 09/09/04Rank: 3Comment:

|

Request Information From Our Sponsors
- StockCharts.com, Inc.
- Candle Patterns
- Candlestick Charting Explained
- Intermarket Technical Analysis
- John Murphy on Chart Analysis
- John Murphy's Chart Pattern Recognition
- John Murphy's Market Message
- MurphyExplainsMarketAnalysis-Intermarket Analysis
- MurphyExplainsMarketAnalysis-Visual Analysis
- StockCharts.com
- Technical Analysis of the Financial Markets
- The Visual Investor
- VectorVest, Inc.
- Executive Premier Workshop
- One-Day Options Course
- OptionsPro
- Retirement Income Workshop
- Sure-Fire Trading Systems (VectorVest, Inc.)
- Trading as a Business Workshop
- VectorVest 7 EOD
- VectorVest 7 RealTime/IntraDay
- VectorVest AutoTester
- VectorVest Educational Services
- VectorVest OnLine
- VectorVest Options Analyzer
- VectorVest ProGraphics v6.0
- VectorVest ProTrader 7
- VectorVest RealTime Derby Tool
- VectorVest Simulator
- VectorVest Variator
- VectorVest Watchdog
