HOT TOPICS LIST
- MACD
- Fibonacci
- RSI
- Gann
- ADXR
- Stochastics
- Volume
- Triangles
- Futures
- Cycles
- Volatility
- ZIGZAG
- MESA
- Retracement
- Aroon
INDICATORS LIST
LIST OF TOPICS
PRINT THIS ARTICLE
by Chris Manuell
The British pound is poised to move lower after completing a head & shoulders reversal formation.
Position: N/A
Chris Manuell
Chris Manuell spent 7 years as a futures sales/trader for a large investment bank and more recently as a technical analyst for an independent research company. He has a bachelor of economics and graduate diploma in applied finance & investment. Currently enrolled in the CMT program with the MTA.
PRINT THIS ARTICLE
HEAD & SHOULDERS
British Pound - Head & Shoulders Formation
09/08/04 03:18:36 PMby Chris Manuell
The British pound is poised to move lower after completing a head & shoulders reversal formation.
Position: N/A
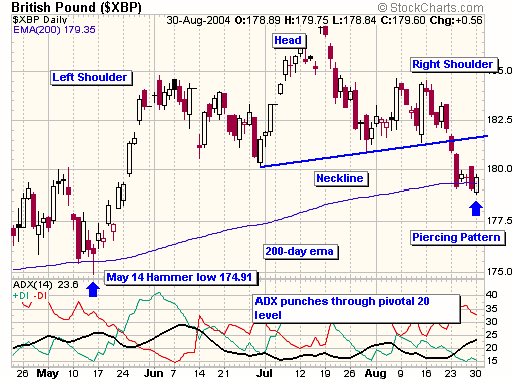
| The British pound appears to have completed the highly popular head and shoulders reversal pattern on the daily charts following its recent summer rally from May 14 lows at 174.91. The chart below demonstrates three well defined peaks - candlestick followers may have spotted a potential reversal earlier - with the head formation in late July also comprising a doji and bearish engulfing reversal pattern. The failure of the August rally to reach the head, July highs, resulted in the right shoulder forming with close symmetry to the June peak and setting up a potential head & shoulders pattern. |
| The pattern was completed with a decisive penetration of the neckline on August 23 and the successive two closes beneath the neckline was added confirmation. The head and shoulders reversal pattern can often be marked by a return move to the neckline, which could be a possibility in this situation. The cable completed a bullish piercing pattern on Aug 30, which is made up of two candles in a falling market. The initial candle is a black real body session and the following candle is a white real body. The white candle opens lower, preferably beneath the low of the prior session, which occurred on Aug 30 with the Cable. Prices then bounce from the open and close well into the black candle's real body. Ideally the second candle should have a white body that intrudes more than halfway into the prior sessions body. Cable completed a bullish piercing line on Aug 30 by closing at the midpoint of the prior session's body. This pattern is a derivative of the bullish engulfing pattern, which envelopes the entire body of the prior candle and illustrates that new lows could not hold. |

|
| Figure 1: Daily chart of the British pound. |
| Graphic provided by: StockCharts.com. |
| |
| The recent failure to convincingly penetrate the 200-day ema at 179.35 with two successive closes beneath, might also encourage a retest of the neckline in the 182 region. The 200-day ema was effective support in mid-May with the market unable to close beneath that average and then enjoying a two-month rally. |
| The return move does not always materialize or is sometimes only a mild bounce. Volume can also dictate the extent of the bounce. If the initial piercing of the neckline is on heavy volume, the chances for a return move are diminished because the expansive volume reflects increased intensity in the move down. Given that we are in summer holiday trading mode - the lower volume neckline break would support a retest in the short-term. A retest of the head and shoulders neckline would present conservative traders with an opportunity to short the cable. A move back above the neckline would negate the pattern and also minimize the risk of the trade. |
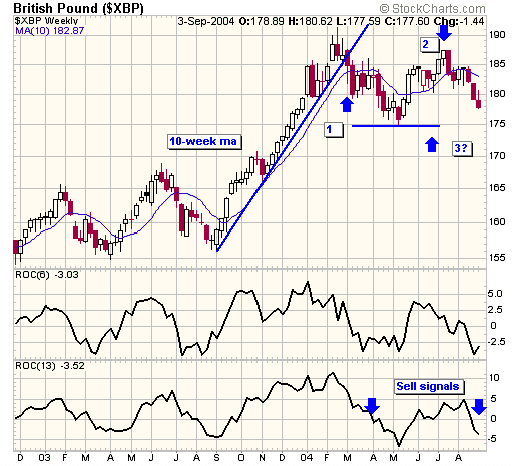
| The price objective of the head and shoulders reversal pattern is based on the height of the pattern. The height of the pattern is calculated by taking the vertical distance from the head to the neckline. In the case of the cable, the top of the head is 187.36 and the neckline from July 16 is 180.55. The height of the pattern is therefore 6.81 (187.36 -180.55). The objective can then be achieved by subtracting that total from the point where the neckline was penetrated. The cable broke the neckline at 181.51 on August 23 thus projecting a downside objective of 174.70. (181.51 - 6.81). This objective also corresponds to the region where the market formed a reaction low on May 14 at 174.91 with a hammer low. Another factor supporting an eventual move lower is the rising daily ADX, which has also spent the summer marking time, and has recently pierced the integral +20 level. This could result in the downtrend picking up momentum as the head and shoulders reversal pattern unfolds. A Look at the Weekly Chart The British Pound or Cable is displaying some characteristics that may lead to a reversal of the medium-term up trend, as well. The weekly chart of the cable demonstrates an increasing probability that a changing of the guard is unfolding. Victor Sperandeo in his book Trader Vic developed a method that is helpful in identifying reversals in mature trends - the 1-2-3 Rule. The 1-2-3 reversal technique incorporates or replicates other forms of technical analysis, including trend analysis in Dow theory and the double-top formation in chart analysis. This can be illustrated in the Cable. The first rule is a break of the trendline - of which Sperandeo is vigilante in his definition of trendline: " for an uptrend within the period of consideration, draw a line from the lowest low, up to the highest minor low point preceding the highest high such that the line does not pass through prices in between the two low points." The Cable satisfies this requirement with the penetration of the bullish trendline from last September breached in the first week of May. This is the first signal of a trend reversal. The second requirement is that prices must stop recording higher highs in an uptrend, or lower lows in a downtrend. This occurred in Cable with the inability of the July highs to surpass the February peak following the bounce from the May trough in the 175 region. The Cable failed in its "test" of the high point and backed away from it. The Cable has thus completed 2 conditions of the 1-2-3 rule marking a high chance that a change of trend is unfolding.  Figure 2: Weekly chart for the British pound. The third condition requires that the market trades below the previous short-term minor low in an uptrend. A breach of the May trough at 174.91 on the weekly Cable chart would conclude the criteria for a 1-2-3 reversal, which "defines a change of trend". An alternative method for determining a medium term trend change is by using an objective method. Martin Pring in his insightful book 'Investment Psychology Explained' outlines his mechanical trading system for the Pound. His Rules for selling the Pound Sterling were to open a short position when the cable is below its 10-week moving average and 13-week rate of change is below zero and 6-week rate of change is below zero. Looking at the chart we can see that a sell signal was triggered in the first week of April with the market below the 10-week ma and the 13-week ROC following the 6-week ROC into negative territory. This resulted in the downdraft to the May trough at 174.91. The trade would have been closed out and reversed in the last week of May when a buy signal was generated by a reversal of the above conditions. The cable has subsequently triggered another short signal crossing below its 10-week ma and with both the 6-week and 13-week ROC shifting below zero. Pring's trading system may be a leading indicator for a completion of Sperandeo's 1-2-3 trend reversal which may mark an end of the cables rally that commenced in the early months of 2002. |
Chris Manuell spent 7 years as a futures sales/trader for a large investment bank and more recently as a technical analyst for an independent research company. He has a bachelor of economics and graduate diploma in applied finance & investment. Currently enrolled in the CMT program with the MTA.
| E-mail address: | chrismanuell5@yahoo.co.uk |
Click here for more information about our publications!
Comments
Date: 09/09/04Rank: 3Comment:

|

Request Information From Our Sponsors
- StockCharts.com, Inc.
- Candle Patterns
- Candlestick Charting Explained
- Intermarket Technical Analysis
- John Murphy on Chart Analysis
- John Murphy's Chart Pattern Recognition
- John Murphy's Market Message
- MurphyExplainsMarketAnalysis-Intermarket Analysis
- MurphyExplainsMarketAnalysis-Visual Analysis
- StockCharts.com
- Technical Analysis of the Financial Markets
- The Visual Investor
- VectorVest, Inc.
- Executive Premier Workshop
- One-Day Options Course
- OptionsPro
- Retirement Income Workshop
- Sure-Fire Trading Systems (VectorVest, Inc.)
- Trading as a Business Workshop
- VectorVest 7 EOD
- VectorVest 7 RealTime/IntraDay
- VectorVest AutoTester
- VectorVest Educational Services
- VectorVest OnLine
- VectorVest Options Analyzer
- VectorVest ProGraphics v6.0
- VectorVest ProTrader 7
- VectorVest RealTime Derby Tool
- VectorVest Simulator
- VectorVest Variator
- VectorVest Watchdog
