HOT TOPICS LIST
- MACD
- Fibonacci
- RSI
- Gann
- ADXR
- Stochastics
- Volume
- Triangles
- Futures
- Cycles
- Volatility
- ZIGZAG
- MESA
- Retracement
- Aroon
INDICATORS LIST
LIST OF TOPICS
PRINT THIS ARTICLE
by Jason Braswell
Natural gas has just shot through major support and is quickly headed south. In its wake, it is leaving some interesting intermonth relationships.
Position: Sell
Jason Braswell
Jason Braswell is the Director of Risk Management Services for Infinite Consulting, LLC. He attended graduate school for mathematics at the University of Florida in Gainesville and is an MTA affiliate.
PRINT THIS ARTICLE
SPREAD TRADING
Natural Gas Falling Out
09/03/04 12:35:48 PMby Jason Braswell
Natural gas has just shot through major support and is quickly headed south. In its wake, it is leaving some interesting intermonth relationships.
Position: Sell
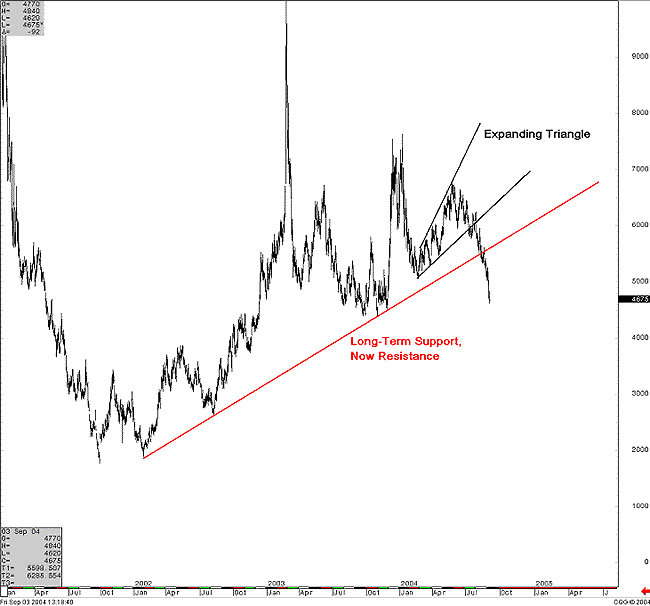
| The last time I wrote about Natural Gas ("NYMEX Gas Making A Decision Soon," Traders.com Advantage, 8/13/04) I expressed some doubt as to whether or not natural gas had enough steam to break through long-term support on its next pass. But I painted a slightly more sanguine picture for such an event later on, due to gas having broken out of an expanding triangle pattern in mid-summer, which had measuring implications below long-term support. It turns out I was wrong on the first call, as natural gas has since barreled through both its 2-1/2 year support and its 2004 low, and it is now approaching its 2003 low. |

|
| Figure 1: Daily chart. |
| Graphic provided by: CQG Net. |
| |
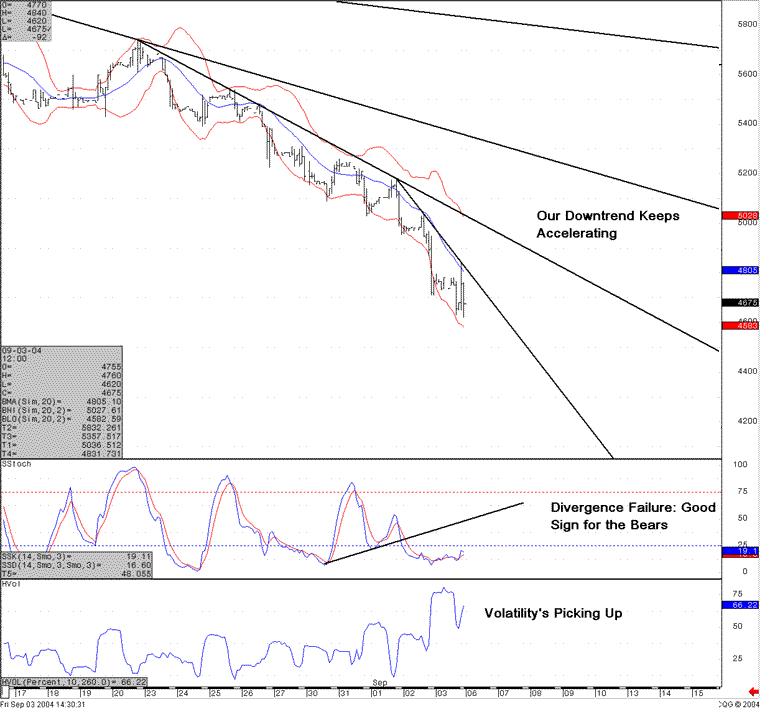
Ever since breaking through this support, the downtrend has accelerated, likely causing problems for anyone trying to trade countertrend (including yours truly), as oscillators are oversold and staying there. The strength of the downtrend can be seen below on the 120-minute chart. Every time a new down trendline is established, another one pops up to undergird the fallout. Even the usually dependable signal of bullish divergence failed below with the stochastic oscillator, rendering an especially strong bear signal -- what Alexander Elder calls "The Hound of Baskervilles" signal. Figure 2: 120-minute chart. Guessing where this trend will go is a tough call. The last time natural gas broke through strong weekly support, it went to $1.85, down from its peak of $10.10. However, the next big test of support will be in the $4.39 to $4.54 area, as $4.39 marks a two-year low, and the area right above it saw dense consolidation before prices exploded toward $7.00 at the beginning of last winter. If prices penetrate this support, it's a pretty barren technical landscape for a couple of dollars down. |
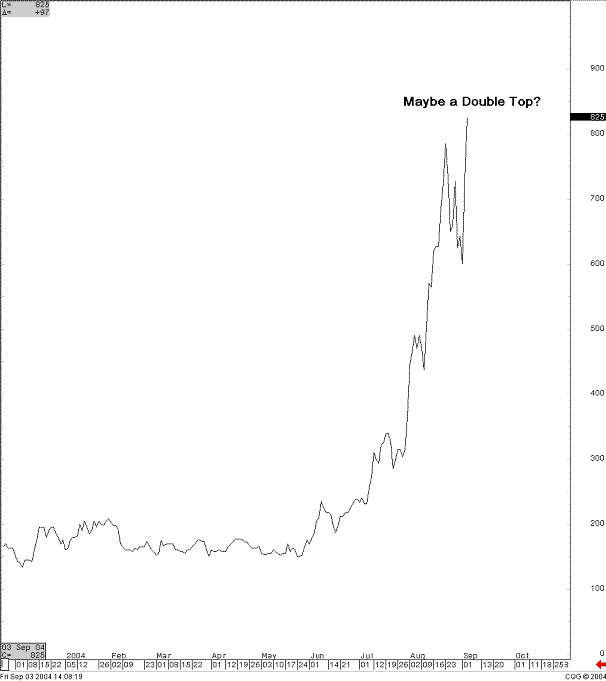
| One interesting thing about this downtrend is that the intracommodity spreads are unprecedented for the natural gas market. For example, the chart below graphs the difference between November and October, which now sits at $0.82, or about 17% of the current front month price. Unless something totally new happens in the market, you can hardly go wrong spread trading these two months, taking advantage of the low margins and the almost certain subsequent narrowing of this spread. For those who aren't yet inclined to do this, waiting for a confirmation of the potential double top formation on this chart before entering the trade might offer a big more assurance. These massive spreads continue to the Nov-Dec and Dec-Jan periods. Because our new long-term resistance on the continuous chart should keep pulling these high winter months down, there's money to be made on the spread right now, which probably has something to do with the huge spread position the Commitment of Traders Report is showing! |
 Figure 3: Oct-Nov spread. Besides trading the spread, call writing is another good opportunity right now, as volatility is kicking up, and each of those bear trendlines provide resistance, against which you can position the strikes. |
Jason Braswell is the Director of Risk Management Services for Infinite Consulting, LLC. He attended graduate school for mathematics at the University of Florida in Gainesville and is an MTA affiliate.
| Company: | Infinite Consulting, LLC |
| Website: | www.infiniteconsulting.org |
| E-mail address: | jbraswell@infiniteconsulting.org |
Traders' Resource Links | |
| Infinite Consulting, LLC has not added any product or service information to TRADERS' RESOURCE. | |
Click here for more information about our publications!
Comments
Date: 09/04/04Rank: 3Comment:
Date: 09/10/04Rank: 4Comment:
Date: 09/17/04Rank: 5Comment:

|

Request Information From Our Sponsors
- StockCharts.com, Inc.
- Candle Patterns
- Candlestick Charting Explained
- Intermarket Technical Analysis
- John Murphy on Chart Analysis
- John Murphy's Chart Pattern Recognition
- John Murphy's Market Message
- MurphyExplainsMarketAnalysis-Intermarket Analysis
- MurphyExplainsMarketAnalysis-Visual Analysis
- StockCharts.com
- Technical Analysis of the Financial Markets
- The Visual Investor
- VectorVest, Inc.
- Executive Premier Workshop
- One-Day Options Course
- OptionsPro
- Retirement Income Workshop
- Sure-Fire Trading Systems (VectorVest, Inc.)
- Trading as a Business Workshop
- VectorVest 7 EOD
- VectorVest 7 RealTime/IntraDay
- VectorVest AutoTester
- VectorVest Educational Services
- VectorVest OnLine
- VectorVest Options Analyzer
- VectorVest ProGraphics v6.0
- VectorVest ProTrader 7
- VectorVest RealTime Derby Tool
- VectorVest Simulator
- VectorVest Variator
- VectorVest Watchdog
