HOT TOPICS LIST
- MACD
- Fibonacci
- RSI
- Gann
- ADXR
- Stochastics
- Volume
- Triangles
- Futures
- Cycles
- Volatility
- ZIGZAG
- MESA
- Retracement
- Aroon
INDICATORS LIST
LIST OF TOPICS
PRINT THIS ARTICLE
by Chris Manuell
Petrochina (PTR) has developed a bullish ascending triangle that could propel the stock towards its December high of 63.70.
Position: N/A
Chris Manuell
Chris Manuell spent 7 years as a futures sales/trader for a large investment bank and more recently as a technical analyst for an independent research company. He has a bachelor of economics and graduate diploma in applied finance & investment. Currently enrolled in the CMT program with the MTA.
PRINT THIS ARTICLE
TRIANGLES
Petrochina - Ascending Triangle
09/03/04 09:18:18 AMby Chris Manuell
Petrochina (PTR) has developed a bullish ascending triangle that could propel the stock towards its December high of 63.70.
Position: N/A
| An ascending triangle is characterized by a horizontal trendline drawn across the minor highs with a rising trendline connecting the reaction lows. While the ascending triangle mainly forms in an uptrend it can also emerge as bottoming formation - such as in Petrochina. |

|
| Graphic provided by: Stockcharts.com. |
| |
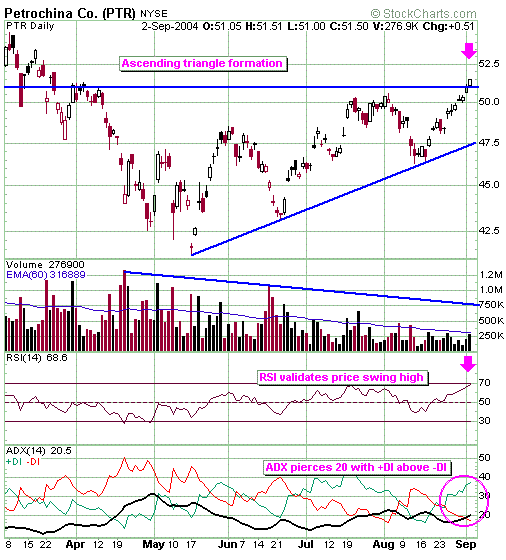
| Petrochina has satisfied the requirements for an ascending triangle with the prices forming two minor highs at the horizontal resistance line in early April and then again in early August. Prices need not touch the trendline but must come close to the trendline - as was the case in early August. The flat line signifies that bulls can still drive prices higher, however are finding it difficult to sustain the rally. The rising trendline has also been achieved with three distinct bounces since mid-May. This suggests that bears are losing their control to push prices lower. |
| The ascending triangle also meets the volume characteristic - with volume heavy at the start of the formation and then diminishing as the pattern matures. Volume usually tapers off leading into the breakout. An upside breakout would be supported with heavy upside volume in the next few sessions. Petrochina has punctured the horizontal resistance line and we should expect prices to move sharply away from the formation. Triangles have been compared to "coils" as the market remains in a narrowing range, leaving itself vulnerable to a spring higher. The measuring technique for the triangle is the height of the triangle, which is projected from the breakout point. The height of Petrochina's triangle is calculated by subtracting the first minor low from May 12 at 41.28 from the minor high from April 12 at 50.98, which gives us 9.70. Adding 9.70 to the breakout point at 50.98 gives a minimum target of 60.68. The indicators also give weight to the bullish ascending triangle in Petrochina. First, RSI is confirming the recent push higher by price as it moves into overbought territory. Valid breakouts are confirmed when technical indicators reach fresh extreme highs or lows in the direction of the trend. Second, ADX is punching through the important 20 level with +DI above -DI, pointing to a powerful bullish move. |
Chris Manuell spent 7 years as a futures sales/trader for a large investment bank and more recently as a technical analyst for an independent research company. He has a bachelor of economics and graduate diploma in applied finance & investment. Currently enrolled in the CMT program with the MTA.
| E-mail address: | chrismanuell5@yahoo.co.uk |
Click here for more information about our publications!
Comments
Date: 09/03/04Rank: 5Comment:
Date: 09/04/04Rank: 4Comment:

Request Information From Our Sponsors
- StockCharts.com, Inc.
- Candle Patterns
- Candlestick Charting Explained
- Intermarket Technical Analysis
- John Murphy on Chart Analysis
- John Murphy's Chart Pattern Recognition
- John Murphy's Market Message
- MurphyExplainsMarketAnalysis-Intermarket Analysis
- MurphyExplainsMarketAnalysis-Visual Analysis
- StockCharts.com
- Technical Analysis of the Financial Markets
- The Visual Investor
- VectorVest, Inc.
- Executive Premier Workshop
- One-Day Options Course
- OptionsPro
- Retirement Income Workshop
- Sure-Fire Trading Systems (VectorVest, Inc.)
- Trading as a Business Workshop
- VectorVest 7 EOD
- VectorVest 7 RealTime/IntraDay
- VectorVest AutoTester
- VectorVest Educational Services
- VectorVest OnLine
- VectorVest Options Analyzer
- VectorVest ProGraphics v6.0
- VectorVest ProTrader 7
- VectorVest RealTime Derby Tool
- VectorVest Simulator
- VectorVest Variator
- VectorVest Watchdog
