HOT TOPICS LIST
- MACD
- Fibonacci
- RSI
- Gann
- ADXR
- Stochastics
- Volume
- Triangles
- Futures
- Cycles
- Volatility
- ZIGZAG
- MESA
- Retracement
- Aroon
INDICATORS LIST
LIST OF TOPICS
PRINT THIS ARTICLE
by Chris Manuell
IBM has remained in a steady downtrend since February this year after topping out around the century mark. Is a new uptrend about to commence?
Position: N/A
Chris Manuell
Chris Manuell spent 7 years as a futures sales/trader for a large investment bank and more recently as a technical analyst for an independent research company. He has a bachelor of economics and graduate diploma in applied finance & investment. Currently enrolled in the CMT program with the MTA.
PRINT THIS ARTICLE
HEAD & SHOULDERS
IBM - Potential Head & Shoulders Bottom
09/02/04 08:50:54 AMby Chris Manuell
IBM has remained in a steady downtrend since February this year after topping out around the century mark. Is a new uptrend about to commence?
Position: N/A
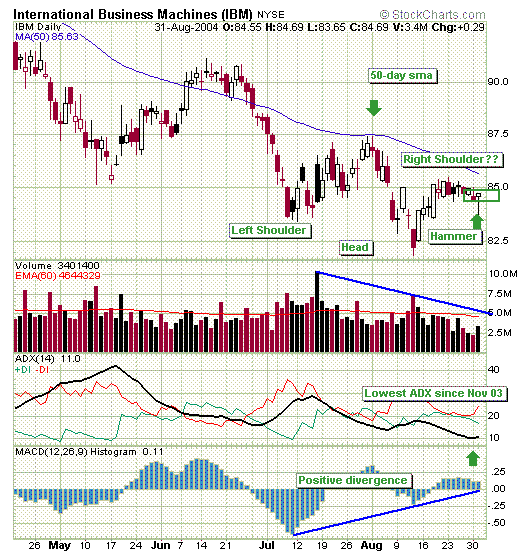
| Traders would have been watching recent price action in IBM's stock as a potential head and shoulders bottom may be unfolding. The head and shoulders bottom is characterized with three distinctive troughs with the middle trough beneath the other two. IBM's first trough or left shoulder was formed in July and the stock subsequently bounced only to be capped by the 50-day SMA (simple moving average) in early August. The price then reasserted the downtrend to surpass the July trough and complete a head. The market has since remained in a tight range and appears to be developing a right shoulder. The hammer formation from August 31 marked on the chart demonstrated a reluctance to push lower. |
| Volume activity has conformed to the pattern's requirements, with volume usually higher on the left shoulder than the right shoulder. Volume plays an important role, with an expansion of trading activity required on a move through the neckline to confirm the pattern. The absence of a definitive neckline may suggest that there is still more price activity required to develop the right shoulder. Although the 50-day SMA acted as a good resistance line in late July and aggressive traders may want to use that as a surrogate neckline. Aggressive traders may have already started accumulating positions in anticipating a head and shoulders pattern was forming after the August trough. Conservative traders could wait for a high volume closing penetration of the 50-day SMA to confirm the pattern. |

|
| Graphic provided by: Stockcharts.com. |
| |
| The MACD histogram attempts to confirm trends when it records new highs or lows. IBM has also provided an argument for a potential reversal with positive divergence on MACD. While IBM's price was completing the left shoulder and then lower trough of the head, MACD was registering a higher trough. This divergence hints that bears are losing momentum and a potential reversal is looming. |
| Daily ADX on IBM is also at its lowest level since November 2003, which underlines the potential for a major trend to develop. Dr Alexander Elder in his excellent book, Trading for a Living suggests that "when ADX rises by four steps, from its lowest point below both Directional lines, it 'rings a bell' on a new trend. It shows that a new bull market or bear market is being born." The IBM ADX is currently at 11 and if it continues to rise by four steps and the +DI line can push above the -DI line, we can expect a new uptrend to commence. |
Chris Manuell spent 7 years as a futures sales/trader for a large investment bank and more recently as a technical analyst for an independent research company. He has a bachelor of economics and graduate diploma in applied finance & investment. Currently enrolled in the CMT program with the MTA.
| E-mail address: | chrismanuell5@yahoo.co.uk |
Click here for more information about our publications!
Comments
Date: 09/04/04Rank: 4Comment:

Request Information From Our Sponsors
- VectorVest, Inc.
- Executive Premier Workshop
- One-Day Options Course
- OptionsPro
- Retirement Income Workshop
- Sure-Fire Trading Systems (VectorVest, Inc.)
- Trading as a Business Workshop
- VectorVest 7 EOD
- VectorVest 7 RealTime/IntraDay
- VectorVest AutoTester
- VectorVest Educational Services
- VectorVest OnLine
- VectorVest Options Analyzer
- VectorVest ProGraphics v6.0
- VectorVest ProTrader 7
- VectorVest RealTime Derby Tool
- VectorVest Simulator
- VectorVest Variator
- VectorVest Watchdog
- StockCharts.com, Inc.
- Candle Patterns
- Candlestick Charting Explained
- Intermarket Technical Analysis
- John Murphy on Chart Analysis
- John Murphy's Chart Pattern Recognition
- John Murphy's Market Message
- MurphyExplainsMarketAnalysis-Intermarket Analysis
- MurphyExplainsMarketAnalysis-Visual Analysis
- StockCharts.com
- Technical Analysis of the Financial Markets
- The Visual Investor
