HOT TOPICS LIST
- MACD
- Fibonacci
- RSI
- Gann
- ADXR
- Stochastics
- Volume
- Triangles
- Futures
- Cycles
- Volatility
- ZIGZAG
- MESA
- Retracement
- Aroon
INDICATORS LIST
LIST OF TOPICS
PRINT THIS ARTICLE
by David Penn
A second wave rally began in mid-August. How far are we from the end of that move and the beginning of a third?
Position: N/A
David Penn
Technical Writer for Technical Analysis of STOCKS & COMMODITIES magazine, Working-Money.com, and Traders.com Advantage.
PRINT THIS ARTICLE
ELLIOTT WAVE
A Taste For Twos
09/02/04 08:09:00 AMby David Penn
A second wave rally began in mid-August. How far are we from the end of that move and the beginning of a third?
Position: N/A
| My last Elliott wave article for Traders.com Advantage "Journey to the End of the Diagonal," July 28, 2004) presented a wave count through mid-August. The article underscored the end of the wave one decline that began at the end of July. What has followed, unsurprisingly enough, has been a wave two rally. Before getting into the technicals, and the way this second wave has unfolded wave for wave, consider what Robert Prechter wrote about second waves in his classic, At the Crest of the Tidal Wave: |
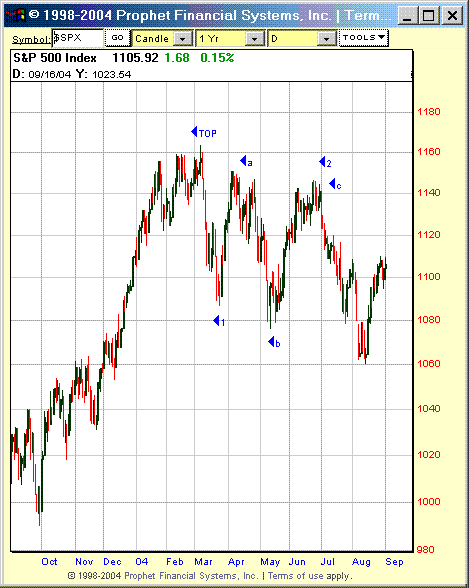
Second waves typically recreate the emotions present at the preceding major turn, so psychology in the wave 2 rally (such as is occurring in bonds now) should be extremely exuberant, reflecting certainty that the bull market has resumed. Be prepared to resist the relentless drumbeat of hopeful opinion that will accompany most of the first and second waves of the bear market. As someone who feared that Elliott Wave discussion doesn't discuss the wave-for-wave psychology for bear markets with near the thoroughness as when discussing that same psychology in bull markets, the original, 450-page edition of At the Crest is a treasure trove. Interestingly, I had just sent an e-mail to a colleague suggesting that the mood of the market this week would be a smaller version of the mood during the week leading up to the funeral of Ronald Reagan back in early June. That rally in June, by some wave counts, led into a wave 2 peak. So much is this the case that I have changed my wave count to make the May lows a "b" wave low instead of a "2" (see below). |

|
| Figure 1: A revised wave count from the first quarter 2004 makes what was a wave 2 low into a wave b low within a larger wave 2. |
| Graphic provided by: Prophet Financial Systems. |
| |
| This new wave count doesn't significantly change my analysis since the late June peak: a five wave pattern downward into the early August lows marked a smaller wave one (now of "minute" degree for those following along. . .). That smaller, minute degree wave one complete, the markets have been enjoying a relief rally, a bear market rally, a wave two rally. By my accounts we are more than half way through this move -- a move that could take the $SPX hurtling back up towards the 1150 area. One reason why I believe the $SPX will make an advance of this extent is that the previous wave 2 -- the move from the March lows to the June highs -- was a flat. Flats are 3-3-5 affairs, a typically feature b waves that retrace all or most of the previous "a" wave. C waves in flats are also relatively mild affairs, tending to end near the end point of the previous "a" wave. The rule of alternation, then, suggests that the next wave two will be a zigzag. A zigzag is another common corrective pattern, one more characterized by sharp and severe price reaction and reaction. Zigzags feature a 5-3-5 wave pattern, which in and of itself suggests greater volatility compared to the flat. |
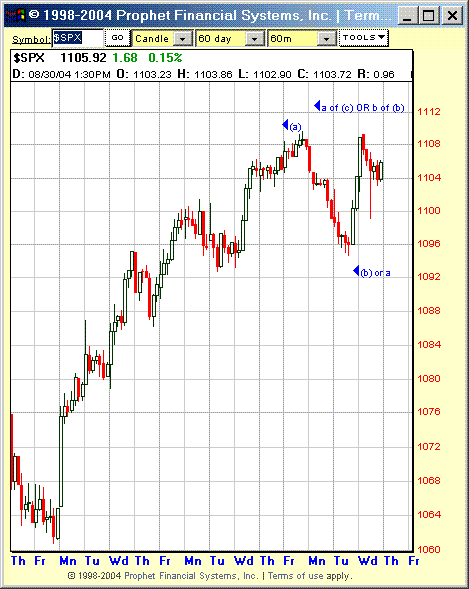
 Figure 2: Zigzag corrections often show a tremendous acceleration which, when appearing in bear markets, often gives the impression that a new bull market has begun. When I look at the S&P 500's rally since mid-August, I see an "A" wave that ended on August 27th after a 50-point advance. The B wave, as can be the case in zigzags, was a brief affair of no more than four days and about 15 points. If the C wave of this pattern is at least as long as wave A, then a 50-point rally from the wave B low at 1095 would see a wave C top near 1145. Given that the closing low for the previous wave 2 (the late June top) was a little over 1144, my suspicion is that the current, lesser wave 2 will fall short -- how short, of course is anyone's guess. |
| I should add that it is quite possible that what is labeled as (b) on this chart could be merely an "a," meaning that wave (b) could be larger than it is presented here. If this were to be the case, then the August 31 peak would represent the b wave top within wave (b) instead of representing the "a" wave top within wave (c). |
Technical Writer for Technical Analysis of STOCKS & COMMODITIES magazine, Working-Money.com, and Traders.com Advantage.
| Title: | Technical Writer |
| Company: | Technical Analysis, Inc. |
| Address: | 4757 California Avenue SW |
| Seattle, WA 98116 | |
| Phone # for sales: | 206 938 0570 |
| Fax: | 206 938 1307 |
| Website: | www.Traders.com |
| E-mail address: | DPenn@traders.com |
Traders' Resource Links | |
| Charting the Stock Market: The Wyckoff Method -- Books | |
| Working-Money.com -- Online Trading Services | |
| Traders.com Advantage -- Online Trading Services | |
| Technical Analysis of Stocks & Commodities -- Publications and Newsletters | |
| Working Money, at Working-Money.com -- Publications and Newsletters | |
| Traders.com Advantage -- Publications and Newsletters | |
| Professional Traders Starter Kit -- Software | |
Click here for more information about our publications!
Comments
Date: 09/04/04Rank: 3Comment:

Request Information From Our Sponsors
- StockCharts.com, Inc.
- Candle Patterns
- Candlestick Charting Explained
- Intermarket Technical Analysis
- John Murphy on Chart Analysis
- John Murphy's Chart Pattern Recognition
- John Murphy's Market Message
- MurphyExplainsMarketAnalysis-Intermarket Analysis
- MurphyExplainsMarketAnalysis-Visual Analysis
- StockCharts.com
- Technical Analysis of the Financial Markets
- The Visual Investor
- VectorVest, Inc.
- Executive Premier Workshop
- One-Day Options Course
- OptionsPro
- Retirement Income Workshop
- Sure-Fire Trading Systems (VectorVest, Inc.)
- Trading as a Business Workshop
- VectorVest 7 EOD
- VectorVest 7 RealTime/IntraDay
- VectorVest AutoTester
- VectorVest Educational Services
- VectorVest OnLine
- VectorVest Options Analyzer
- VectorVest ProGraphics v6.0
- VectorVest ProTrader 7
- VectorVest RealTime Derby Tool
- VectorVest Simulator
- VectorVest Variator
- VectorVest Watchdog
