HOT TOPICS LIST
- MACD
- Fibonacci
- RSI
- Gann
- ADXR
- Stochastics
- Volume
- Triangles
- Futures
- Cycles
- Volatility
- ZIGZAG
- MESA
- Retracement
- Aroon
INDICATORS LIST
LIST OF TOPICS
PRINT THIS ARTICLE
by Gary Grosschadl
This stock appears to be coming off a bottom, similar to a double bottom in some regards.
Position: Buy
Gary Grosschadl
Independent Canadian equities trader and technical analyst based in Peterborough
Ontario, Canada.
PRINT THIS ARTICLE
CHART ANALYSIS
Millennium Pharmaceuticals On Upswing
08/31/04 09:39:31 AMby Gary Grosschadl
This stock appears to be coming off a bottom, similar to a double bottom in some regards.
Position: Buy
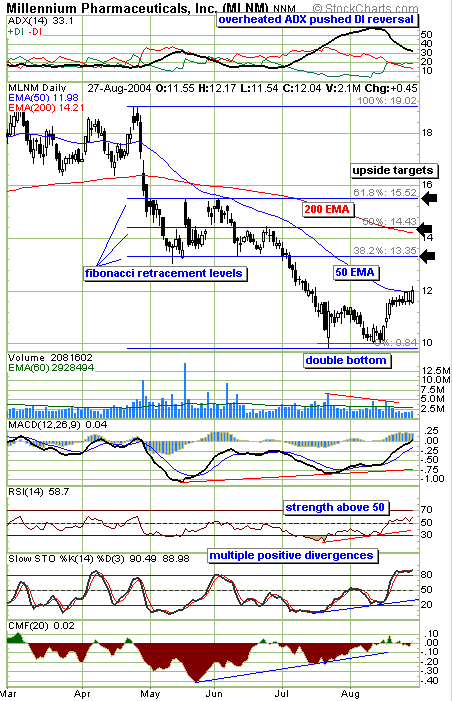
| Since Millennium Pharmaceuticals (MLNM) slid under $16 last May, it has come all the way down to a psychological threshhold of $10. This may be the level where buyers become interested again. Although not a classic double pattern with a more pronounced "W" over a longer period of time, the volume characteristic fits the bill. With a double bottom type of move, a noticeable decline in volume should be seen on the second bottom. This is explained by diminished bearish forces. The bulk of the bears gave up the ghost on the initial bottom and at the subsequent bottom there are fewer bears selling the stock, resulting in lighter trading volumes. |
| The other markers for a move off bottom were the multiple positive divergences to price action. As price came down to another bottom, the indicators below the chart all show a higher bottom, which is bullish. The more divergences you find, the more likely it is that the stock will bounce. |

|
| Daily chart showing upside Fibonacci targets. |
| Graphic provided by: Stockcharts.com. |
| |
| The directional movement indicator at the top of the chart also showed bullish promise during this bottoming phase. The very high ADX value is considered overheated and this tends to be a prelude to the DIs doing a bullish crossover, which shows bullish forces taking the upper hand over the bears. Some traders take an early cue from the ADX peaking and reversing while others may wait for confirmation of the DIs actually crossing. Ideally what happens next is that +DI upslopes to go higher until it assumes the ideal setup with the ADX line inbetween the DIs with +DI on top. This would show growing bullish trend strength. |
| Friday's close was very bullish as the stock price closed just above the 50-day EMA, something that hasn't occured since the initial decline from $18. This can indicate an early sign of trend change in the making. A more reliable sign of a trend change is a series of higher highs and higher lows; but MLMN is not there yet. Friday's move can also be seen as a move beyond a brief period of high consolidation. |
| Using Fibonacci retracement levels based on the significant high and low on the chart, upside targets can be pondered. When these Fibonacci levels are plotted, I pay particular attention to them if they relate to key previous levels of support and resistance, and this seems to be the case here. Note the area of the 200-day EMA is close to the 50% retracement level. This area will likely act as stiff resistance and a possible trading target for aggressive traders. The first target however is the 38.2% level at $13.35. A move back down below recent support of $11.50 would be bearish. In the meantime traders should watch for a move to the upside targets as discussed. |
Independent Canadian equities trader and technical analyst based in Peterborough
Ontario, Canada.
| Website: | www.whatsonsale.ca/financial.html |
| E-mail address: | gwg7@sympatico.ca |
Click here for more information about our publications!
Comments
Date: 09/01/04Rank: 4Comment:

|

Request Information From Our Sponsors
- VectorVest, Inc.
- Executive Premier Workshop
- One-Day Options Course
- OptionsPro
- Retirement Income Workshop
- Sure-Fire Trading Systems (VectorVest, Inc.)
- Trading as a Business Workshop
- VectorVest 7 EOD
- VectorVest 7 RealTime/IntraDay
- VectorVest AutoTester
- VectorVest Educational Services
- VectorVest OnLine
- VectorVest Options Analyzer
- VectorVest ProGraphics v6.0
- VectorVest ProTrader 7
- VectorVest RealTime Derby Tool
- VectorVest Simulator
- VectorVest Variator
- VectorVest Watchdog
- StockCharts.com, Inc.
- Candle Patterns
- Candlestick Charting Explained
- Intermarket Technical Analysis
- John Murphy on Chart Analysis
- John Murphy's Chart Pattern Recognition
- John Murphy's Market Message
- MurphyExplainsMarketAnalysis-Intermarket Analysis
- MurphyExplainsMarketAnalysis-Visual Analysis
- StockCharts.com
- Technical Analysis of the Financial Markets
- The Visual Investor
