HOT TOPICS LIST
- MACD
- Fibonacci
- RSI
- Gann
- ADXR
- Stochastics
- Volume
- Triangles
- Futures
- Cycles
- Volatility
- ZIGZAG
- MESA
- Retracement
- Aroon
INDICATORS LIST
LIST OF TOPICS
PRINT THIS ARTICLE
by Gary Grosschadl
QLGC is showing the first good sign of a early bullish trend change since its previous meltdown.
Position: Buy
Gary Grosschadl
Independent Canadian equities trader and technical analyst based in Peterborough
Ontario, Canada.
PRINT THIS ARTICLE
CHART ANALYSIS
QLogic (QLGC) Makes A Move
08/30/04 10:32:20 AMby Gary Grosschadl
QLGC is showing the first good sign of a early bullish trend change since its previous meltdown.
Position: Buy
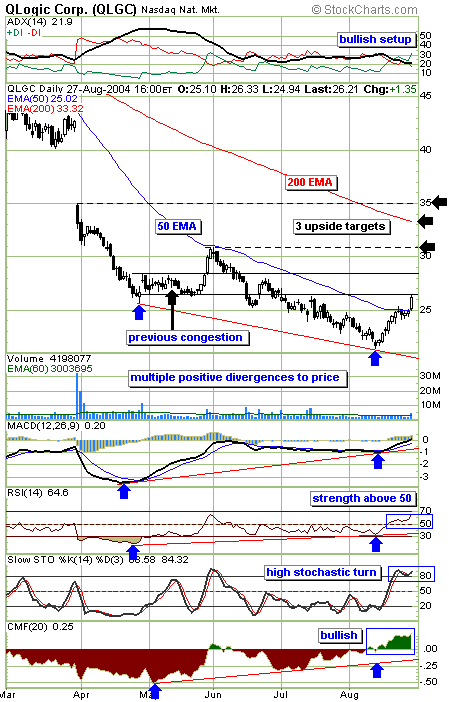
| In the past six months this stock's price has been cut in half. Now it shows early bullish promise of what may prove to be a trend change in the making. Friday's close above the 50-day EMA (exponential moving average) is the first such move since the precipitous decline. I sometimes view moving average lines -- versus straight trendlines -- as dynamic trendlines and this looks like a reasonable example, with this line being "respected" in the past. |
| This stock now has to battle through a previous congestion zone as shown. This may slow down the advance to the upside targets shown unless abnormally high volume emboldens more traders to jump onboard. Three upside targets that may eventually come into play are the previous thrust to $31, the ever important 200-day EMA currently at $33.32, and the lower gap resistance at $35. |

|
| Daily chart shows bullish promise. |
| Graphic provided by: Stockcharts.com. |
| |
| Several indicators reflect bullish promise and are worth discussing. First, the chart shows how the current two week drive was foretold by a series of bullish divergences to the price action. As lower stock prices were made, several indicators refused to follow and instead put in higher lows (blue arrows). This is known as bullish divergence. The directional movement indicator at the top of the chart shows a bullish setup. The ideal setup occurs when the ADX rides between the DIs with a healthy upslope above 20 (some traders prefer ADX above 25). An upturn soon for the ADX would satisfy this. The RSI (relative strength index) is showing good strength above the often important 50 level. The stochastics indicator is showing a high bullish turn which is another bullish sign. Growing trend strength can keep stochastics "sticking high" for an extended period versus a sudden stochastic downleg from overbought conditions. The bottom indicator, the CMF indicator (Chaiken money flow) shows an obvious trend change as bullish demand has taken over from bearish selling pressure. |
| In my view, the outlook remains bullish as long as any consolidation does not close below $24, this being a recent consolidation low. A more bullish consolidation would hold the 50-day EMA line. Traders should be alert for any reversals at or near $28.50 (top of congestion zone), $31, the 200-day EMA, and $35 (upside targets). |
Independent Canadian equities trader and technical analyst based in Peterborough
Ontario, Canada.
| Website: | www.whatsonsale.ca/financial.html |
| E-mail address: | gwg7@sympatico.ca |
Click here for more information about our publications!
Comments
Date: 09/01/04Rank: 4Comment:

Request Information From Our Sponsors
- StockCharts.com, Inc.
- Candle Patterns
- Candlestick Charting Explained
- Intermarket Technical Analysis
- John Murphy on Chart Analysis
- John Murphy's Chart Pattern Recognition
- John Murphy's Market Message
- MurphyExplainsMarketAnalysis-Intermarket Analysis
- MurphyExplainsMarketAnalysis-Visual Analysis
- StockCharts.com
- Technical Analysis of the Financial Markets
- The Visual Investor
- VectorVest, Inc.
- Executive Premier Workshop
- One-Day Options Course
- OptionsPro
- Retirement Income Workshop
- Sure-Fire Trading Systems (VectorVest, Inc.)
- Trading as a Business Workshop
- VectorVest 7 EOD
- VectorVest 7 RealTime/IntraDay
- VectorVest AutoTester
- VectorVest Educational Services
- VectorVest OnLine
- VectorVest Options Analyzer
- VectorVest ProGraphics v6.0
- VectorVest ProTrader 7
- VectorVest RealTime Derby Tool
- VectorVest Simulator
- VectorVest Variator
- VectorVest Watchdog
