HOT TOPICS LIST
- MACD
- Fibonacci
- RSI
- Gann
- ADXR
- Stochastics
- Volume
- Triangles
- Futures
- Cycles
- Volatility
- ZIGZAG
- MESA
- Retracement
- Aroon
INDICATORS LIST
LIST OF TOPICS
PRINT THIS ARTICLE
by Sean Moore
Analyzing supply and demand for a particular security will aid the trader in determining that security's readiness to move. Prices will rally when demand is in control and fall when supply is in control. Being able to recognize this supply/demand relationship can be an important factor in maximizing profits.
Position: N/A
Sean Moore
Traders.com Staff Writer.
PRINT THIS ARTICLE
STRATEGIES
Wyckoff Part 4: Supply vs. Demand
05/22/00 12:35:05 PMby Sean Moore
Analyzing supply and demand for a particular security will aid the trader in determining that security's readiness to move. Prices will rally when demand is in control and fall when supply is in control. Being able to recognize this supply/demand relationship can be an important factor in maximizing profits.
Position: N/A
| Up to this point, Wyckoff has identified potential stocks, preferring those securities from overperforming sectors that are currently in horizontal formations. Next you need to catch these securities when they break out of their horizontal formations. Step 4 of Richard Wyckoff's stock market method states: "Determine each stock's readiness to move, then analyze the vertical line chart and figure chart of the candidates previously selected by the use of buying and selling tests." Vertical charts, also known as bar charts, give price and volume information, while figure charts, a derivation of point and figure charts, give price information and are used to determine the length of a trend. Wyckoff's buying and selling tests are based on perceived supply and demand. When the market is in an uptrend, demand is larger than supply and the prices will rise. Volume should also be increasing. When the uptrend is ending, and supply and demand are equal, the price range will narrow. Now you should check the volume. If it's increasing, then it's likely that the demand is meeting the supply. This usually forcasts a bigger decline than if volume is tailing off, and you should take that into account in your trading decisions. In a downtrend, the inverse is true with demand low and supply high. Wyckoff states that it takes experience to accurately judge the market, and part 5 of this series will discuss those details. But at this stage, it's possible to trade when the market goes into a horizontal formation. |
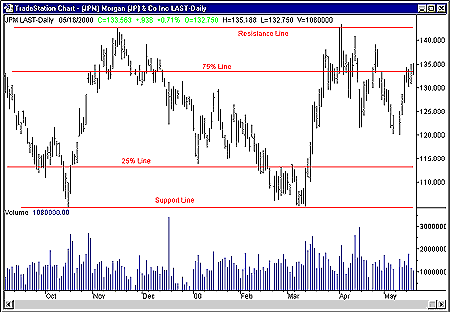
| Figure 1 shows the bar chart for JP Morgan & Co. which has been in a long-term horizontal formation for the past year with the price ranging from $104 to $142. An upper (resistance) line has been drawn at $142 and a lower (support) line at $104. Wyckoff suggests you split the range into quarters, and establish positions in which to enter and exit the market at these points. In this example, the entry and exit points at $113 and $134. When the price is between the support level and the 25% line, you can consider taking a long position. When the price is between the resistance line and the 75% line, you would consider entering a short position. |

|
| Figure 1: Daily bar chart for JP Morgan & Co. For trading this long term trading range, long trades should be entered below the 25% line and short trades above the 75% line. |
| Graphic provided by: TradeStation. |
| |
| You can protect your profits by placing a stop order for each trade. The stop value can be determined using a profit risk ratio. Wyckoff theory suggests that the minimum acceptable profit risk ratio is 3 to 1. So, if the trading range has potential for a 6-point profit, then a stop should be set 2 points above or below the entry point. |
| Paying attention to the supply/demand is certainly an important concept when utilizing Wyckoff's stock analysis method. Recognizing potential for a move will help to improve your trading judgment and, ultimately, help to increase your profits. |
| Related Articles: Wyckoff Part 1: Defining A Trend Wyckoff Part 2: Determining Relative Strength And Weakness Wyckoff Part 3: Recognizing Potential |
Traders.com Staff Writer.
| Title: | Project Engineer |
| Company: | Technical Analysis, Inc. |
| Address: | 4757 California Ave. SW |
| Seattle, WA 98116 | |
| Phone # for sales: | 206 938 0570 |
| Fax: | 206 938 1307 |
| Website: | Traders.com |
| E-mail address: | smoore@traders.com |
Traders' Resource Links | |
| Charting the Stock Market: The Wyckoff Method -- Books | |
| Working-Money.com -- Online Trading Services | |
| Traders.com Advantage -- Online Trading Services | |
| Technical Analysis of Stocks & Commodities -- Publications and Newsletters | |
| Working Money, at Working-Money.com -- Publications and Newsletters | |
| Traders.com Advantage -- Publications and Newsletters | |
| Professional Traders Starter Kit -- Software | |
Click here for more information about our publications!
Comments

Request Information From Our Sponsors
- StockCharts.com, Inc.
- Candle Patterns
- Candlestick Charting Explained
- Intermarket Technical Analysis
- John Murphy on Chart Analysis
- John Murphy's Chart Pattern Recognition
- John Murphy's Market Message
- MurphyExplainsMarketAnalysis-Intermarket Analysis
- MurphyExplainsMarketAnalysis-Visual Analysis
- StockCharts.com
- Technical Analysis of the Financial Markets
- The Visual Investor
- VectorVest, Inc.
- Executive Premier Workshop
- One-Day Options Course
- OptionsPro
- Retirement Income Workshop
- Sure-Fire Trading Systems (VectorVest, Inc.)
- Trading as a Business Workshop
- VectorVest 7 EOD
- VectorVest 7 RealTime/IntraDay
- VectorVest AutoTester
- VectorVest Educational Services
- VectorVest OnLine
- VectorVest Options Analyzer
- VectorVest ProGraphics v6.0
- VectorVest ProTrader 7
- VectorVest RealTime Derby Tool
- VectorVest Simulator
- VectorVest Variator
- VectorVest Watchdog
