

HOT TOPICS LIST
- MACD
- Fibonacci
- RSI
- Gann
- ADXR
- Stochastics
- Volume
- Triangles
- Futures
- Cycles
- Volatility
- ZIGZAG
- MESA
- Retracement
- Aroon
INDICATORS LIST
LIST OF TOPICS
PRINT THIS ARTICLE
by Chris Manuell
The agricultural index looks to reverse a downtrend that started in April 2004.
Position: N/A
Chris Manuell
Chris Manuell spent 7 years as a futures sales/trader for a large investment bank and more recently as a technical analyst for an independent research company. He has a bachelor of economics and graduate diploma in applied finance & investment. Currently enrolled in the CMT program with the MTA.
PRINT THIS ARTICLE
CANDLESTICK CHARTING
Agricultural Index 2B Hammer
08/27/04 11:04:36 AMby Chris Manuell
The agricultural index looks to reverse a downtrend that started in April 2004.
Position: N/A
| Commodities as an asset class are capturing plenty of attention with the vertical spurt of oil grabbing more headlines than Texas' other big export: George Bush. A useful way to monitor commodities is through the Goldman Sachs Commodities Index (GSCI) -- "a world production-weighted index of commodity prices. . . based on the average quantity of production in the last five years of available data." ("The Goldman Roll," by Scott Barrie and Kevin Warner, Technical Analysis of Stocks & Commodities, August 2003). |
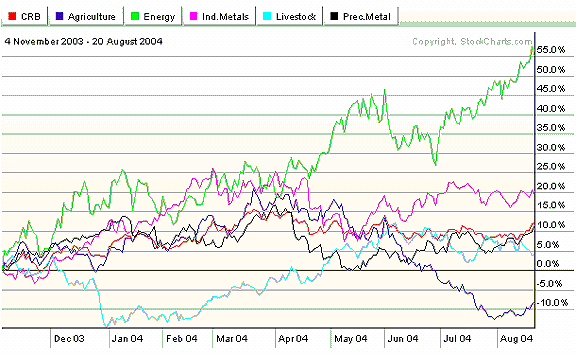
| The sub-groups of the GSCI are considered a reliable barometer for the price activity of the different commodities that constitute the GSCI. Currently the Energy subgroup index (GJX) is the leading sub-group- up 55.05% from Nov. 4, 2003 - Aug. 20, 2004 at the time of writing. On the flipside is the Agricultural subgroup Index (GKX) which appears to have being left in the paddock in comparison to the energy sector, down 8.06% in the same period. The chart attests to these divergent price patterns with the agricultural and energy indexes going their separate ways in April 2004. The Agricultural index includes orange juice, cocoa, sugar, coffee, soybeans, corn, red wheat, and wheat; while components of the energy index include crude oil, brent crude oil, unleaded gasoline, heating oil, and natural gas. |
|
| Figure 1: The subgroups of the Goldman Sachs Commodities Index (GSCI). |
| Graphic provided by: StockCharts.com. |
| |
| In this article I will focus on the reversal potential for the agricultural index GKX. The index has attempted to stall the decline from the March 23 high at 246.46 with a couple of bottom reversal signals emerging on the recent August 16 swing low at 177.08. The first such signal was the effective and popular Japanese candlestick reversal pattern - the hammer. The doyen of candlestick analysis Steve Nison outlines three requirements for the hammer: a close near the upper end of the sessions trading range, a long lower shadow which is twice the size of the height of the body and finally no, or a tiny, upper shadow. The hammer depicts a market that has been forced lower by the bears; however the discovery of lower prices attracts the bulls and the rejection of the lows is demonstrated by the lengthy lower shadow on the candle. |
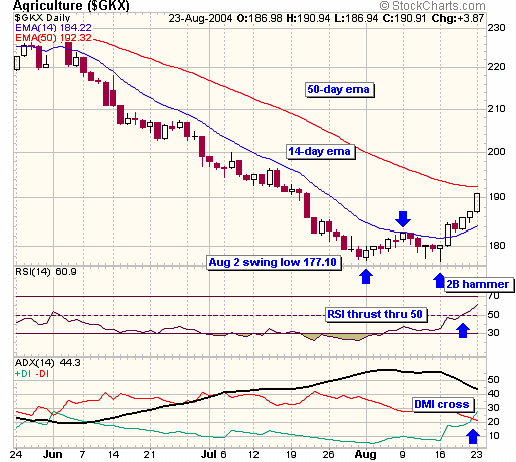 Figure 2: Daily chart for $GKX. The agricultural index completed a textbook hammer on August 16 with the market rebounding from its low at 177.08 to close on its high at 180.29. Although the color of the real body of the hammer can be either white or black - it is slightly more bullish if the real body is white. The Japanese have labelled a white hammer as a "power line" and the aforementioned hammer is in that category. The hammer was also confirmed with a strong rally in the following session on August 17 where the index completed a bullish belt hold. This is a tall white candlestick that opens on its low and drives higher to close well above its opening price. This "candlestick combo" underscored how the agricultural index was rejecting lower prices and presaged a potential reversal from the recent downtrend. The other potential reversal signal generated by the agricultural index is the 2B test of a low. This method was developed by Victor Sperandeo and is also a favorite of Working Money magazine staff writer David Penn. The 2B test occurs when the market records a swing low, bounces from that point and then shortly after resumes the downtrend to surpass the prior swing low. The 2B mechanism is concluded when the market fails to follow-through on the downside following the fresh swing low - hinting that a potential reversal is in the offing. This can be illustrated with the recent price action in the agricultural index. The index pushed lower to yearly lows on August 2nd at 177.10 and then enjoyed a mild rally until resistance at the 14-day EMA stemmed the bounce on August 10, and the market reasserted the downtrend. This resulted in bears pushing the market to new lows on August 16 to 177.08 - breaching the August 2 minor swing low of 177.10 - and setting up a potential 2B test of a bottom. As discussed earlier, this session on August 16 also resulted in the formation of a hammer marking a rejection of the lows and a failure to follow-through to complete a 2B test of the bottom. The "2B hammer" heightened the chances that a reversal was in the making. Following the completion of the 2B hammer the index has undergone a sharp rally enabling a breach above the 14-day EMA and momentum appears to be rising with a breach of the pivotal RSI midpoint line at 50. This suggests further upside potential in the medium-term and further supports the reversal theme. The directional movement indicator has also recently triggered a buy signal with the +DI crossing over the -DI line. Longer-term chart analysis provides the trader with the opportunity to examine the market from a longer-range perspective and can be achieved by looking at the weekly chart. An examination of the weekly agricultural index chart would have increased the confidence that a reversal was possible, as a long-term support line was identified in the 175 region - allowing the 2b hammer to take shape on the daily picture. Examining technical indicators on a weekly chart also carries more weight than those same indicators on a daily chart. Looking at some weekly indicators on the agricultural index corroborates the short-term bounce. The failure by bears to penetrate the 175 region also resulted in waning bearish momentum as demonstrated by the weekly MACD histogram slope turning up from an overextended position. An oscillator such as RSI also provides an excellent gauge of assessing if a current price move has become overextended. This occurs when its value reaches an extreme reading near the upper/lower end of its boundary. The weekly agriculture index RSI reached its most oversold level in over three years, making it vulnerable to a reversal of the recent downmove. Traders tend to treat a crossing back above the 30 line as an indication that the trend in the oscillator has turned up. This occurred recently on the weekly agriculture index and was also complemented with a breach in the weekly RSI trendline. Trendlines on oscillators tend to be pierced sooner than those on the price chart - which supports a continued move higher on the agricultural index. |
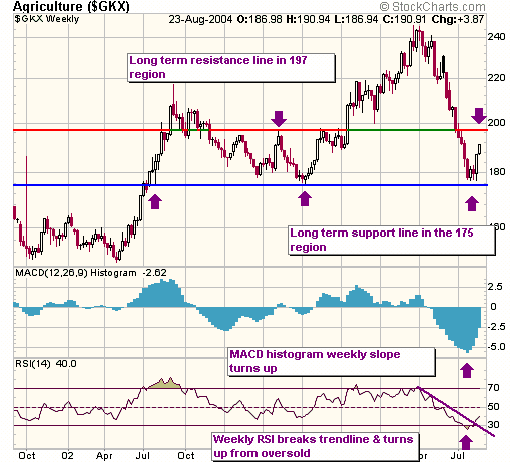 Figure 3: Weekly chart for $GKX. In summary it appears likely that the agricultural index will attempt to reverse its recent weakness from April and mount a challenge on the long-term resistance line in the 197 region highlighted on the weekly chart. |
Chris Manuell spent 7 years as a futures sales/trader for a large investment bank and more recently as a technical analyst for an independent research company. He has a bachelor of economics and graduate diploma in applied finance & investment. Currently enrolled in the CMT program with the MTA.
| E-mail address: | chrismanuell5@yahoo.co.uk |
Click here for more information about our publications!
Comments
Date:�09/01/04Rank:�4Comment:�

Request Information From Our Sponsors
- VectorVest, Inc.
- Executive Premier Workshop
- One-Day Options Course
- OptionsPro
- Retirement Income Workshop
- Sure-Fire Trading Systems (VectorVest, Inc.)
- Trading as a Business Workshop
- VectorVest 7 EOD
- VectorVest 7 RealTime/IntraDay
- VectorVest AutoTester
- VectorVest Educational Services
- VectorVest OnLine
- VectorVest Options Analyzer
- VectorVest ProGraphics v6.0
- VectorVest ProTrader 7
- VectorVest RealTime Derby Tool
- VectorVest Simulator
- VectorVest Variator
- VectorVest Watchdog
- StockCharts.com, Inc.
- Candle Patterns
- Candlestick Charting Explained
- Intermarket Technical Analysis
- John Murphy on Chart Analysis
- John Murphy's Chart Pattern Recognition
- John Murphy's Market Message
- MurphyExplainsMarketAnalysis-Intermarket Analysis
- MurphyExplainsMarketAnalysis-Visual Analysis
- StockCharts.com
- Technical Analysis of the Financial Markets
- The Visual Investor