HOT TOPICS LIST
- MACD
- Fibonacci
- RSI
- Gann
- ADXR
- Stochastics
- Volume
- Triangles
- Futures
- Cycles
- Volatility
- ZIGZAG
- MESA
- Retracement
- Aroon
INDICATORS LIST
LIST OF TOPICS
PRINT THIS ARTICLE
by Koos van der Merwe
You are in your car driving through the Sahara Desert. Your car is fitted with an XM Satellite radio, so you are in touch with the news of the world.
Position: Hold
Koos van der Merwe
Has been a technical analyst since 1969, and has worked as a futures and options trader with First Financial Futures in Johannesburg, South Africa.
PRINT THIS ARTICLE
XM Satellite Radio Holdings, Inc.
08/26/04 12:08:35 PMby Koos van der Merwe
You are in your car driving through the Sahara Desert. Your car is fitted with an XM Satellite radio, so you are in touch with the news of the world.
Position: Hold
| Fiction? At the moment yes, because XM Satellite Radio does not beam into Africa. . . yet. However, according to their numerous TV commercials, they are beginning to make their mark in North America, and if you are driving anywhere from Dallas to Seattle you can listen to your favorite station without touching a button. This is what they are trying to achieve. What do their charts tell us? |

|
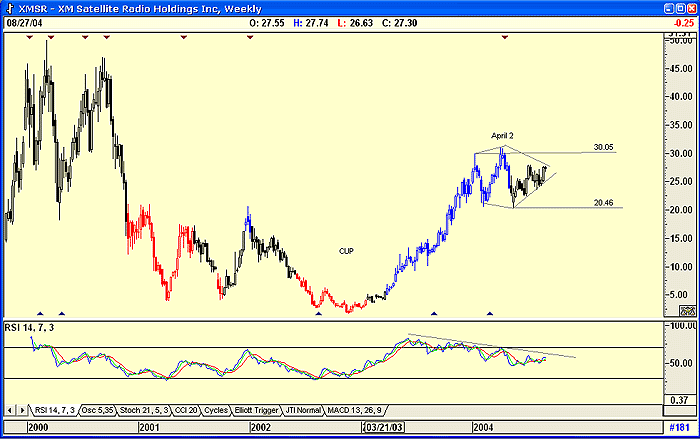
| Figure 1: Weekly chart of XMSR. |
| Graphic provided by: SuperCharts. |
| |
| The first chart is a weekly chart, showing a huge cup and handle formation. When the price broke above $30.05 on April 2nd, 2004, you could have expected the price to rise strongly to new heights, but it fell back, and in falling testing the low of $20.78. From this price it started rising and now seems to be forming a diamond pattern. Admittedly this assumption is early, but because diamond patterns are bearish, and the RSI indicator is trending downwards, the pattern is setting off alarm signals. Any move below $20.78 will be very negative. |
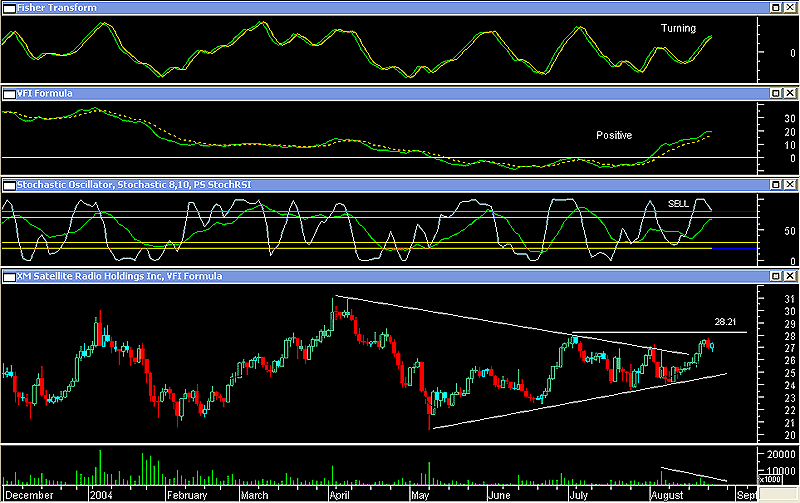
 Figure 2: Daily chart of XMSR. Graphic provided by: MetaStock. Turning to the daily chart, I have shown a number of indicators that can assist in determining the direction of the trend. 1. Fisher Transform developed by Ehlers. At the moment it is showing that the trend is up, but the green line does appear to be turning so it could move down in the near future. 2. VFI Formula by Markos Katsanos. I like this indicator because it includes volume. The indicator is suggesting strength because it is above zero, but it appears to be turning, suggesting caution. When the solid green line crosses the dotted yellow line, a sell signal will be given. 3. Stochastic Oscillator. 8,10,3 (white line). This indicator is overbought and looks likely to give a sell should the price fall. 4. The Stochastic RSI indicator (green line). This is not at overbought levels, suggesting there could still be some upside. 5. Finally the chart itself. The price has broken above the short-term trendline, but on what appears to be low volume. On daily charts, I would be a buyer should the price break above $28.21. |
| To conclude, this share is worth watching. The daily chart is suggesting a short-term buy in the offing. The weekly chart is far more negative. |
Has been a technical analyst since 1969, and has worked as a futures and options trader with First Financial Futures in Johannesburg, South Africa.
| Address: | 3256 West 24th Ave |
| Vancouver, BC | |
| Phone # for sales: | 6042634214 |
| E-mail address: | petroosp@gmail.com |
Click here for more information about our publications!
Comments
Date: 08/26/04Rank: 3Comment:

|

Request Information From Our Sponsors
- StockCharts.com, Inc.
- Candle Patterns
- Candlestick Charting Explained
- Intermarket Technical Analysis
- John Murphy on Chart Analysis
- John Murphy's Chart Pattern Recognition
- John Murphy's Market Message
- MurphyExplainsMarketAnalysis-Intermarket Analysis
- MurphyExplainsMarketAnalysis-Visual Analysis
- StockCharts.com
- Technical Analysis of the Financial Markets
- The Visual Investor
- VectorVest, Inc.
- Executive Premier Workshop
- One-Day Options Course
- OptionsPro
- Retirement Income Workshop
- Sure-Fire Trading Systems (VectorVest, Inc.)
- Trading as a Business Workshop
- VectorVest 7 EOD
- VectorVest 7 RealTime/IntraDay
- VectorVest AutoTester
- VectorVest Educational Services
- VectorVest OnLine
- VectorVest Options Analyzer
- VectorVest ProGraphics v6.0
- VectorVest ProTrader 7
- VectorVest RealTime Derby Tool
- VectorVest Simulator
- VectorVest Variator
- VectorVest Watchdog
