HOT TOPICS LIST
- MACD
- Fibonacci
- RSI
- Gann
- ADXR
- Stochastics
- Volume
- Triangles
- Futures
- Cycles
- Volatility
- ZIGZAG
- MESA
- Retracement
- Aroon
INDICATORS LIST
LIST OF TOPICS
PRINT THIS ARTICLE
by Chris Manuell
Honeywell (HON) completed a textbook hammer formation on the daily chart on August 13.
Position: N/A
Chris Manuell
Chris Manuell spent 7 years as a futures sales/trader for a large investment bank and more recently as a technical analyst for an independent research company. He has a bachelor of economics and graduate diploma in applied finance & investment. Currently enrolled in the CMT program with the MTA.
PRINT THIS ARTICLE
CANDLESTICK CHARTING
Honeywell Hammer
08/24/04 08:25:51 AMby Chris Manuell
Honeywell (HON) completed a textbook hammer formation on the daily chart on August 13.
Position: N/A
| The hammer is a popular bottom reversal pattern in the Japanese candlesticks charting technique. The basic requirements for a hammer formation are that it occur in a trending stock and have a small "body," either black or white, with a long lower shadow. Honeywell completed the required criteria for a hammer with the real body at the upper end of the day's range and with the market closing on its high, for added confirmation. The long lower shadow, which represents a sharp bounce from the session low, is also present on the formation. |
| One of the many attractions of candlestick patterns is their visual dimension that allows a formation like the hammer to aptly depict market psychology. The hammer displays a market that has attempted to sustain a move lower only to discover underlying support, which results in a sharp bounce with prices closing on their session highs. |

|
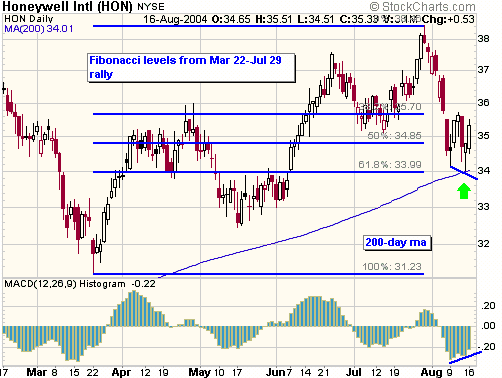
| Figure 1: Daily chart for HON. The green arrow points out the textbook hammer candlestick. |
| Graphic provided by: StockCharts.com. |
| |
| Honeywell formed a hammer after finding support at a confluence of support levels in the $34.00 region, which encouraged a sharp rally from the lows on August 13. First, the market retraced to its 200-day SMA at $34.00. The SMA, or simple moving average, often acts as a support level that stalls corrections from long-term trends. Second, the market came close to the .618 Fibonacci retracement of the recent rally from the March 22 low at $31.23 to the July 29 high at $38.46, which occurs at $33.99. Third, the $34.00 level was also a former resistance level, as demonstrated in the May to June period where prices were in a confined trading range. These factors all provided ammunition for the bulls to trigger a sharp rejection of the $34 level and form a hammer on August 13. |
| Bulls would have also taken solace from the positive divergence that developed on the MACD histogram. While the hammer on August 13 was making a lower low on the price, the MACD histogram was tracing out a higher low. This illustrated waning momentum as the bears' control was diminishing. This positive divergence on Honeywell supports the bullish ramifications of the hammer and enhances the chances of a resumption of the medium-term uptrend. |
Chris Manuell spent 7 years as a futures sales/trader for a large investment bank and more recently as a technical analyst for an independent research company. He has a bachelor of economics and graduate diploma in applied finance & investment. Currently enrolled in the CMT program with the MTA.
| E-mail address: | chrismanuell5@yahoo.co.uk |
Click here for more information about our publications!
PRINT THIS ARTICLE

Request Information From Our Sponsors
- StockCharts.com, Inc.
- Candle Patterns
- Candlestick Charting Explained
- Intermarket Technical Analysis
- John Murphy on Chart Analysis
- John Murphy's Chart Pattern Recognition
- John Murphy's Market Message
- MurphyExplainsMarketAnalysis-Intermarket Analysis
- MurphyExplainsMarketAnalysis-Visual Analysis
- StockCharts.com
- Technical Analysis of the Financial Markets
- The Visual Investor
- VectorVest, Inc.
- Executive Premier Workshop
- One-Day Options Course
- OptionsPro
- Retirement Income Workshop
- Sure-Fire Trading Systems (VectorVest, Inc.)
- Trading as a Business Workshop
- VectorVest 7 EOD
- VectorVest 7 RealTime/IntraDay
- VectorVest AutoTester
- VectorVest Educational Services
- VectorVest OnLine
- VectorVest Options Analyzer
- VectorVest ProGraphics v6.0
- VectorVest ProTrader 7
- VectorVest RealTime Derby Tool
- VectorVest Simulator
- VectorVest Variator
- VectorVest Watchdog
