HOT TOPICS LIST
- MACD
- Fibonacci
- RSI
- Gann
- ADXR
- Stochastics
- Volume
- Triangles
- Futures
- Cycles
- Volatility
- ZIGZAG
- MESA
- Retracement
- Aroon
INDICATORS LIST
LIST OF TOPICS
PRINT THIS ARTICLE
by Ashwani Gujral
Markets move sideways about 70% of the time. The S&P 500 has been in a 70-point range of a downward sloping channel since April 2004. Is this resilience in the face of an expected oil shock or is this the lull before the storm? Either way, get ready to trade it.
Position: N/A
Ashwani Gujral
He is founder of AGIP Securities Pvt. Ltd. which offers money management services, live chat rooms (during market hours) and independent technical analysis consultancy. The company has a big media presence from the likes of CNBC, NDTV Profit, and ZEE Business.
PRINT THIS ARTICLE
CHANNEL LINES
S&P 500 Correction May Be Ending
08/24/04 09:31:11 AMby Ashwani Gujral
Markets move sideways about 70% of the time. The S&P 500 has been in a 70-point range of a downward sloping channel since April 2004. Is this resilience in the face of an expected oil shock or is this the lull before the storm? Either way, get ready to trade it.
Position: N/A
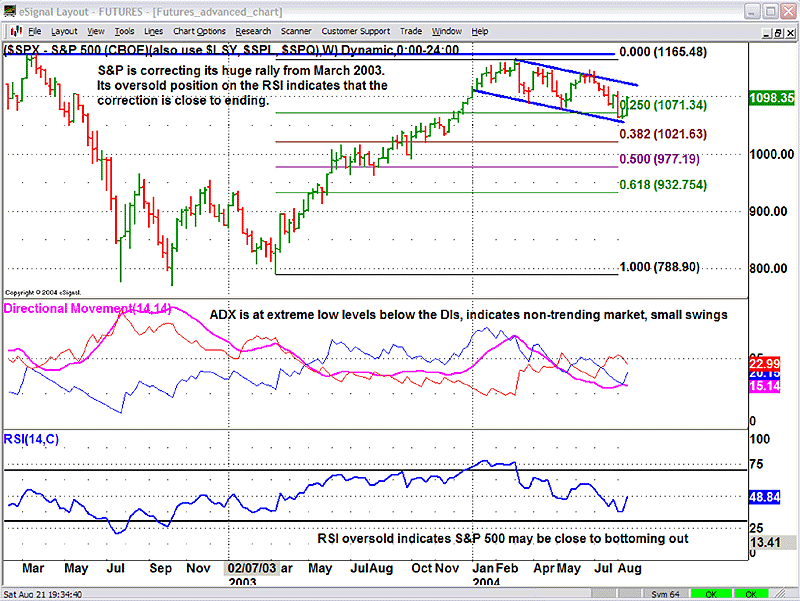
| The S&P 500 has been in downward sloping channel since April 2004. This is a sideways correction to the rally from March 2003, which has substantially corrected the extreme overbought condition on the weekly chart. The kind of resilience this market has shown in the face of extremely high oil prices and the impending U.S. election indicates the strength of this market. Traders should remember corrections take place both in terms of price and time. The important point during corrections is that the markets should shift from an overbought to oversold condition to build strength for a further rally. Hence what may appear to a daily trader as a downmove, would appear to a weekly trader as a minimal correction of the previous rally. This underlies the need to look at more than one time frame while assessing a market. |
 Figure 1: Weekly chart of the S&P 500. On the weekly chart, the S&P 500 shows a minimal correction of about 25% of the previous rally that started in March 2003. This rally saw the S&P 500 move from 800 to 1165. A 25% correction of any rally is really a minimal correction and shows a lot of strength in this market. A correction even to 1021 is acceptable, as that would be the 38.2% of the previous move. The ADX meanwhile has declined from 34 to 15 and below the two DIs. An ADX moving to such low levels and then rising above the lower DI gives a trading signal in the direction of the higher DI. These signals appear once or twice an year on the weekly chart and often lead to powerful moves. We should expect such a signal if the S&P 500 breaks out beyond 1120. The 14-period RSI meanwhile has also reached levels of about 40, which are correction levels of any bull market. Based on this evidence, the S&P may be ready to move up strongly on a weekly basis. |

|
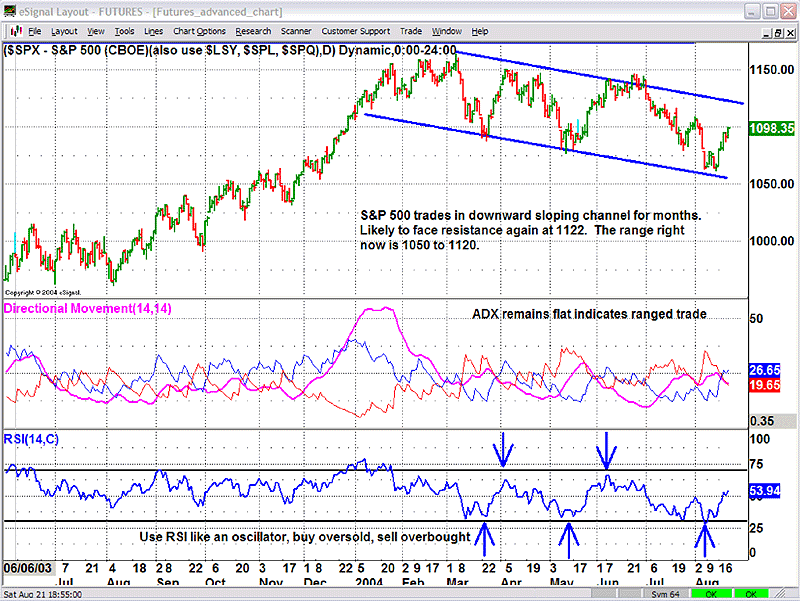
| Figure 2: Daily chart of the S&P 500. |
| Graphic provided by: eSignal. |
| |
| On the daily chart, the S&P 500 remains in downward sloping channel. The ADX remains flat and indicates range trading in the short term. Declining ADX values below 20 indicate a trendless market with small swings. Such a range-bound market should be traded using oscillators like the RSI, buying at the lower channel boundary and selling at the higher channel boundary. Traders can also use straddles as a strategy to capture premiums in a range-bound market. |
| To recap, the S&P has been correcting the 2003 rally for the last four months and soon, near the last week of September, seasonal factors are likely to come into play which will facilitate a rally on the S&P. Until then, trade range-bound or wait to capture the trending move due after this long sideways move. |
He is founder of AGIP Securities Pvt. Ltd. which offers money management services, live chat rooms (during market hours) and independent technical analysis consultancy. The company has a big media presence from the likes of CNBC, NDTV Profit, and ZEE Business.
| Title: | Chief mkt strategist |
| Company: | AGIP Securities |
| India | |
| Phone # for sales: | 9871066337 |
| Website: | www.ashwanigujral.com |
| E-mail address: | contact@ashwanigujral.com |
Traders' Resource Links | |
| AGIP Securities has not added any product or service information to TRADERS' RESOURCE. | |
Click here for more information about our publications!
Comments
Date: 08/24/04Rank: 5Comment:

|

Request Information From Our Sponsors
- StockCharts.com, Inc.
- Candle Patterns
- Candlestick Charting Explained
- Intermarket Technical Analysis
- John Murphy on Chart Analysis
- John Murphy's Chart Pattern Recognition
- John Murphy's Market Message
- MurphyExplainsMarketAnalysis-Intermarket Analysis
- MurphyExplainsMarketAnalysis-Visual Analysis
- StockCharts.com
- Technical Analysis of the Financial Markets
- The Visual Investor
- VectorVest, Inc.
- Executive Premier Workshop
- One-Day Options Course
- OptionsPro
- Retirement Income Workshop
- Sure-Fire Trading Systems (VectorVest, Inc.)
- Trading as a Business Workshop
- VectorVest 7 EOD
- VectorVest 7 RealTime/IntraDay
- VectorVest AutoTester
- VectorVest Educational Services
- VectorVest OnLine
- VectorVest Options Analyzer
- VectorVest ProGraphics v6.0
- VectorVest ProTrader 7
- VectorVest RealTime Derby Tool
- VectorVest Simulator
- VectorVest Variator
- VectorVest Watchdog
