HOT TOPICS LIST
- MACD
- Fibonacci
- RSI
- Gann
- ADXR
- Stochastics
- Volume
- Triangles
- Futures
- Cycles
- Volatility
- ZIGZAG
- MESA
- Retracement
- Aroon
INDICATORS LIST
LIST OF TOPICS
PRINT THIS ARTICLE
by Ashwani Gujral
After an upmove, Jupitermedia Corp. (JUPM) consolidated for three to four months and then broke out for the next upmove. On a weekly basis, the stock is moving up from a 3-year base.
Position: N/A
Ashwani Gujral
He is founder of AGIP Securities Pvt. Ltd. which offers money management services, live chat rooms (during market hours) and independent technical analysis consultancy. The company has a big media presence from the likes of CNBC, NDTV Profit, and ZEE Business.
PRINT THIS ARTICLE
CONSOLID FORMATION
Jupitermedia Corp. Poised For A Reversal
08/24/04 09:36:21 AMby Ashwani Gujral
After an upmove, Jupitermedia Corp. (JUPM) consolidated for three to four months and then broke out for the next upmove. On a weekly basis, the stock is moving up from a 3-year base.
Position: N/A
| Stocks often take years to bottom out, particularly after huge bear market moves. This happens when high flying stocks are butchered as their hype dies down. As these stocks go off the radar of investors and traders, the companies behind them restructure and reinvent their business models. This process takes years. Many companies never recover, but a few do. Those knowledgeable traders who can pick out these select companies use the "flat period" over the next two to three years, to accumulate such stocks. Slowly they bottom out and begin making higher tops and bottoms. The bottoming out appears on their daily charts when the stock makes an initial upmove, consolidates and breaks out upwards again. |
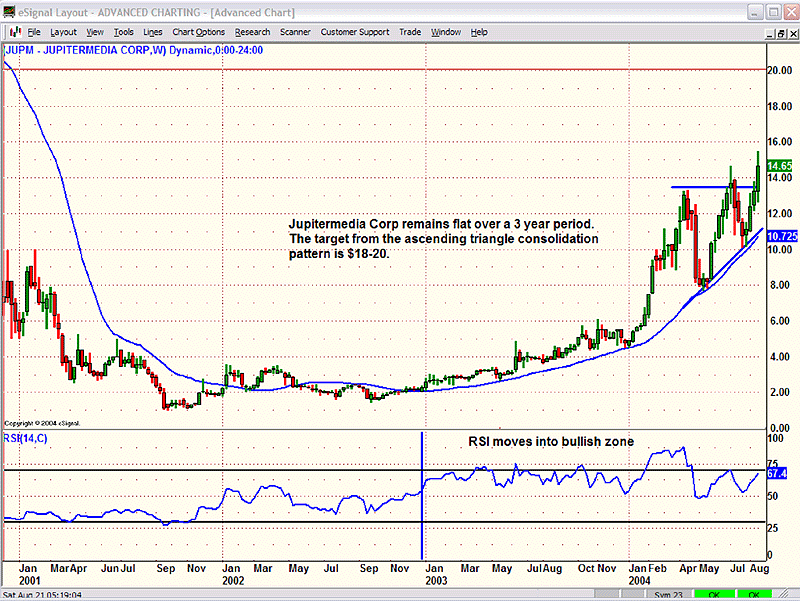
 Figure 1: Weekly chart of JUPM. On the weekly chart, Jupitermedia Corp. carved out a flattish pattern over a 3-year period. The 30-week moving average supported the price at several points on corrections and indicated continued strength. A breakout at $6 led to a sharp rally to about $14, after which the stock consolidated, forming an ascending triangle pattern. It broke out above $14 on Thursday, August 19. The target price could be $18-20. It can be assumed that the consolidation pattern formed approximately in the middle of the upmove. The target was then calculated by taking the difference of the approximate start of the upmove, which was about $4, to the end at $14 - a $10 increase. The move beyond the triangle consolidation pattern is measured from the $8 level, the point where the consolidation pattern began. This gives a target of $18 ($8 + $10). Notice that the weekly RSI has entered the bullish zone after being in a bearish zone for a long period. |

|
| Figure 2: Daily chart of JUPM. |
| Graphic provided by: eSignal. |
| |
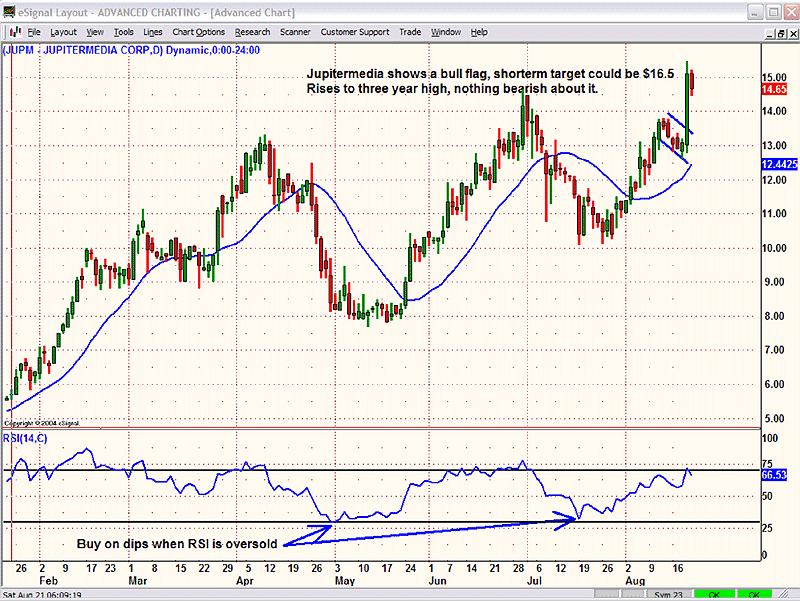
| On the daily chart, the stock is in a consistent uptrend. There were two opportunities for entering as identified by the 14-period RSI. The stock had previously broken out of a bull flag and is headed towards its logical target of $16.50. This target is calculated by measuring the initial move from $10 to $14, and then extrapolating it from the bottom of the bull flag, which is $12.50 ($12.50 + $4.00) to give $16.50. As a trader it is prudent to wait for a consolidation on the daily chart before entering the next breakout because this pattern is so close to its target. |
| As I've shown on Jupitermedia, stocks that are at two to three year highs are the lowest risk stocks in any market, particularly in markets that are going sideways to down. These stocks can be expected to outperform as the market correction/consolidation ends. |
He is founder of AGIP Securities Pvt. Ltd. which offers money management services, live chat rooms (during market hours) and independent technical analysis consultancy. The company has a big media presence from the likes of CNBC, NDTV Profit, and ZEE Business.
| Title: | Chief mkt strategist |
| Company: | AGIP Securities |
| India | |
| Phone # for sales: | 9871066337 |
| Website: | www.ashwanigujral.com |
| E-mail address: | contact@ashwanigujral.com |
Traders' Resource Links | |
| AGIP Securities has not added any product or service information to TRADERS' RESOURCE. | |
Click here for more information about our publications!
Comments
Date: 08/24/04Rank: 4Comment:

Request Information From Our Sponsors
- StockCharts.com, Inc.
- Candle Patterns
- Candlestick Charting Explained
- Intermarket Technical Analysis
- John Murphy on Chart Analysis
- John Murphy's Chart Pattern Recognition
- John Murphy's Market Message
- MurphyExplainsMarketAnalysis-Intermarket Analysis
- MurphyExplainsMarketAnalysis-Visual Analysis
- StockCharts.com
- Technical Analysis of the Financial Markets
- The Visual Investor
- VectorVest, Inc.
- Executive Premier Workshop
- One-Day Options Course
- OptionsPro
- Retirement Income Workshop
- Sure-Fire Trading Systems (VectorVest, Inc.)
- Trading as a Business Workshop
- VectorVest 7 EOD
- VectorVest 7 RealTime/IntraDay
- VectorVest AutoTester
- VectorVest Educational Services
- VectorVest OnLine
- VectorVest Options Analyzer
- VectorVest ProGraphics v6.0
- VectorVest ProTrader 7
- VectorVest RealTime Derby Tool
- VectorVest Simulator
- VectorVest Variator
- VectorVest Watchdog
