HOT TOPICS LIST
- MACD
- Fibonacci
- RSI
- Gann
- ADXR
- Stochastics
- Volume
- Triangles
- Futures
- Cycles
- Volatility
- ZIGZAG
- MESA
- Retracement
- Aroon
INDICATORS LIST
LIST OF TOPICS
PRINT THIS ARTICLE
by Kevin Hopson
Short-term indicators predict a forthcoming bottom reversal, while the long-term pattern points to higher prices.
Position: Hold
Kevin Hopson
Kevin has been a technical analyst for roughly 10 years now. Previously, Kevin owned his own business and acted as a registered investment advisor, specializing in energy. He was also a freelance oil analyst for Orient Trading Co., a commodity futures trading firm in Japan. Kevin is currently a freelance writer.
PRINT THIS ARTICLE
TECHNICAL ANALYSIS
Is Cimarex Energy Poised To Move Higher?
08/24/04 09:40:18 AMby Kevin Hopson
Short-term indicators predict a forthcoming bottom reversal, while the long-term pattern points to higher prices.
Position: Hold
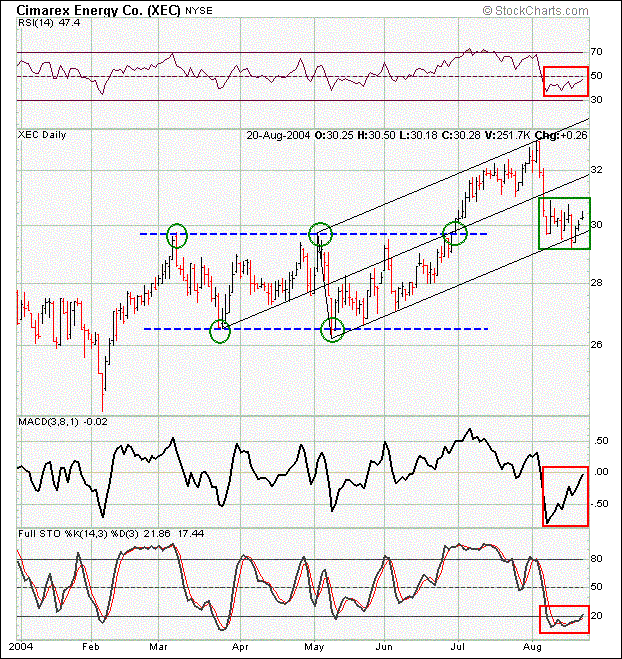
| Cimarex Energy Co. (XEC) sold off in early August and has found itself in a steady decline since then. However, positive divergences on the daily chart and a bullish long-term pattern may point to a reversal soon, as well as an eventual breakout to new highs. The relative strength index (RSI), moving average convergence/divergence (MACD), and full stochastics have all been putting in higher lows despite the fact that the stock price has been trading lower. These divergences are often indicative of a forthcoming bottom reversal. |
| In the meantime, the stock has pulled back to a couple of key support levels. Notice how prices have been contained within the black pitchfork since early May. Prices recently bounced off the bottom parallel line, which is typical with a pitchfork formation. Additionally, Cimarex has pulled back to this summer's trading range breakout point around the $29.60 level. Since prior resistance levels tend to act as support, prices have held up here thus far. |

|
| Graphic provided by: Stockcharts.com. |
| |
| This trading range breakout indicates the potential for much higher prices in the long-term. Cimarex could eventually make its way up to the $36.00 to $39.00 range. I calculated this price target by taking the number of times that prices tested the upper channel line in alternate sequence before breaking out, multiplying this figure (3) by the width of the trading range ($29.60 - $26.40 = $3.20) and then adding this number (3 * $3.20 = $9.60) to the bottom ($26.40 + $9.60 = $36.00) and top ($29.60 + $9.60 = $39.20) channel lines. Since the stock appears to be in a developing bottom pattern and the recent trading range breakout indicates significant upside potential, I would continue to hold shares of Cimarex Energy. |
Kevin has been a technical analyst for roughly 10 years now. Previously, Kevin owned his own business and acted as a registered investment advisor, specializing in energy. He was also a freelance oil analyst for Orient Trading Co., a commodity futures trading firm in Japan. Kevin is currently a freelance writer.
| Glen Allen, VA | |
| E-mail address: | hopson_1@yahoo.com |
Click here for more information about our publications!
Comments
Date: 08/24/04Rank: 3Comment:

Request Information From Our Sponsors
- VectorVest, Inc.
- Executive Premier Workshop
- One-Day Options Course
- OptionsPro
- Retirement Income Workshop
- Sure-Fire Trading Systems (VectorVest, Inc.)
- Trading as a Business Workshop
- VectorVest 7 EOD
- VectorVest 7 RealTime/IntraDay
- VectorVest AutoTester
- VectorVest Educational Services
- VectorVest OnLine
- VectorVest Options Analyzer
- VectorVest ProGraphics v6.0
- VectorVest ProTrader 7
- VectorVest RealTime Derby Tool
- VectorVest Simulator
- VectorVest Variator
- VectorVest Watchdog
- StockCharts.com, Inc.
- Candle Patterns
- Candlestick Charting Explained
- Intermarket Technical Analysis
- John Murphy on Chart Analysis
- John Murphy's Chart Pattern Recognition
- John Murphy's Market Message
- MurphyExplainsMarketAnalysis-Intermarket Analysis
- MurphyExplainsMarketAnalysis-Visual Analysis
- StockCharts.com
- Technical Analysis of the Financial Markets
- The Visual Investor
