HOT TOPICS LIST
- MACD
- Fibonacci
- RSI
- Gann
- ADXR
- Stochastics
- Volume
- Triangles
- Futures
- Cycles
- Volatility
- ZIGZAG
- MESA
- Retracement
- Aroon
INDICATORS LIST
LIST OF TOPICS
PRINT THIS ARTICLE
by Ashwani Gujral
Qualcomm has been in a bull market since April 2004. It is outperforming the Nasdaq, even as the Nasdaq has corrected, thus proving the old Wall Street adage: there is always a bull market somewhere.
Position: N/A
Ashwani Gujral
He is founder of AGIP Securities Pvt. Ltd. which offers money management services, live chat rooms (during market hours) and independent technical analysis consultancy. The company has a big media presence from the likes of CNBC, NDTV Profit, and ZEE Business.
PRINT THIS ARTICLE
CONSOLID FORMATION
Qualcomm Bullish, Even As Nasdaq Corrects
08/24/04 09:42:23 AMby Ashwani Gujral
Qualcomm has been in a bull market since April 2004. It is outperforming the Nasdaq, even as the Nasdaq has corrected, thus proving the old Wall Street adage: there is always a bull market somewhere.
Position: N/A
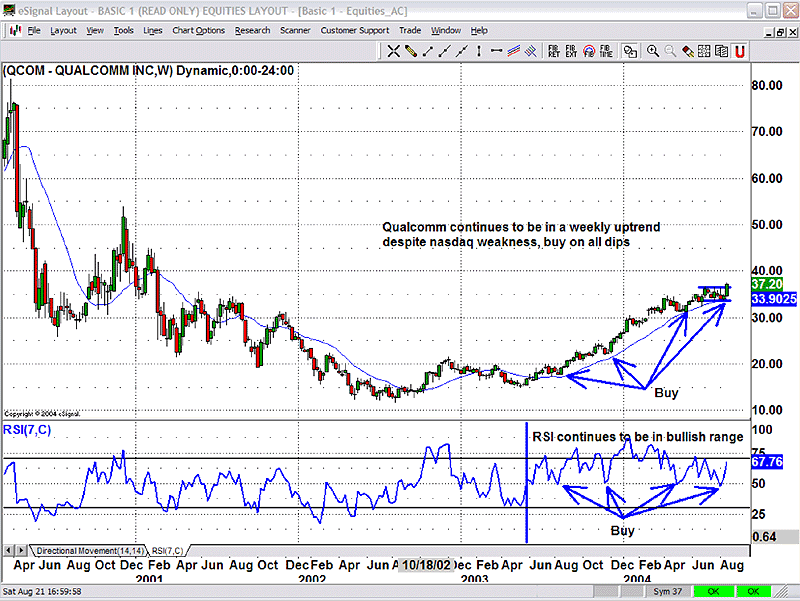
Certain stocks keep outperforming the broader markets even as the market corrects or consolidates. While the Nasdaq is negative for the year, some stocks continue to make multiyear highs. Such stocks move sideways when the markets go down and break out again as the markets revive. These are the stocks that create wealth in uncertain markets and, above all, give capital protection. When there is no secular bull market, investors and traders should hunt for such stocks and buy them on all dips. Qualcomm is one such stock that continues to show a strong uptrend on both the daily and weekly charts despite weak trends in the market indexes. Figure 1: Weekly chart of QCOM. |
| On the weekly chart, Qualcomm shows a big, basing pattern that has broken out to the upside. This pattern is showing a consistent uptrend, making higher tops and bottoms, with several consolidations along the way. The 7-day RSI has entered a bullish zone and is giving signals as buying opportunities occur. These signals are given each time the RSI finds support at the 40-50 level, an indication of the stock's strength. Also a 20-week moving average can be used to give support to the buy signal. |

|
| Figure 2: Daily chart of QCOM. |
| Graphic provided by: eSignal. |
| |
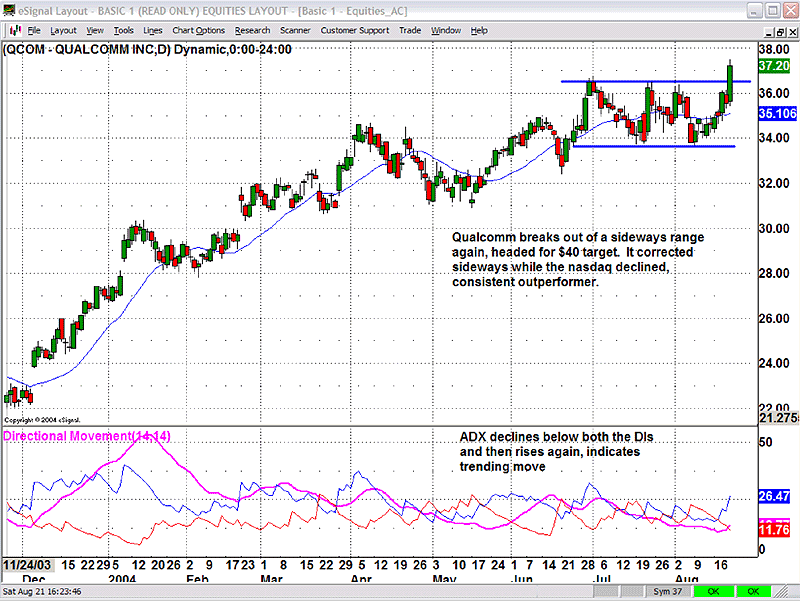
| On the daily chart, Qualcomm has consolidated sideways for the last five to six weeks as the Nasdaq declined. It broke out of the consolidation on Friday, August 20. A short-term target of this sideways breakout is $40. The consolidation can be assumed to have occurred in the middle of an uptrend, so the target is calculated by taking the upmove from $31.00 to $36.50 and then adding the difference ($5.50) to $34, which provides an approximate target of $40. Traders need to remember these are only minimum targets and are often exceeded by wide margins. The ADX, which had corrected to very low levels below both the DIs, is now rising and crossing over the lower DI which is a buy signal, and indicates a trending move to the upside can be expected. |
| In conclusion, there are stock and sector-specific bull markets, even when the markets are correcting or consolidating. These outperforming sectors and stocks provide an excellent vehicle for wealth protection and enhancement in uncertain sideways markets. |
He is founder of AGIP Securities Pvt. Ltd. which offers money management services, live chat rooms (during market hours) and independent technical analysis consultancy. The company has a big media presence from the likes of CNBC, NDTV Profit, and ZEE Business.
| Title: | Chief mkt strategist |
| Company: | AGIP Securities |
| India | |
| Phone # for sales: | 9871066337 |
| Website: | www.ashwanigujral.com |
| E-mail address: | contact@ashwanigujral.com |
Traders' Resource Links | |
| AGIP Securities has not added any product or service information to TRADERS' RESOURCE. | |
Click here for more information about our publications!
Comments
Date: 08/24/04Rank: 5Comment:
Date: 08/26/04Rank: Comment: Your report on Qualcom dt 24/8 makes interesting reading. While going through the weekly charts you do not mention about the negative divergence RSI is making with price. Do you feel that the uptrend would be intact despite the divergence.

|

Request Information From Our Sponsors
- StockCharts.com, Inc.
- Candle Patterns
- Candlestick Charting Explained
- Intermarket Technical Analysis
- John Murphy on Chart Analysis
- John Murphy's Chart Pattern Recognition
- John Murphy's Market Message
- MurphyExplainsMarketAnalysis-Intermarket Analysis
- MurphyExplainsMarketAnalysis-Visual Analysis
- StockCharts.com
- Technical Analysis of the Financial Markets
- The Visual Investor
- VectorVest, Inc.
- Executive Premier Workshop
- One-Day Options Course
- OptionsPro
- Retirement Income Workshop
- Sure-Fire Trading Systems (VectorVest, Inc.)
- Trading as a Business Workshop
- VectorVest 7 EOD
- VectorVest 7 RealTime/IntraDay
- VectorVest AutoTester
- VectorVest Educational Services
- VectorVest OnLine
- VectorVest Options Analyzer
- VectorVest ProGraphics v6.0
- VectorVest ProTrader 7
- VectorVest RealTime Derby Tool
- VectorVest Simulator
- VectorVest Variator
- VectorVest Watchdog
