HOT TOPICS LIST
- MACD
- Fibonacci
- RSI
- Gann
- ADXR
- Stochastics
- Volume
- Triangles
- Futures
- Cycles
- Volatility
- ZIGZAG
- MESA
- Retracement
- Aroon
INDICATORS LIST
LIST OF TOPICS
PRINT THIS ARTICLE
by Gary Grosschadl
For the first time this summer, the price of gold is back above $410 and gold bugs are hopeful of a good move developing.
Position: Buy
Gary Grosschadl
Independent Canadian equities trader and technical analyst based in Peterborough
Ontario, Canada.
PRINT THIS ARTICLE
ANDREWS PITCH-FORK
Gold Making A Move
08/23/04 09:37:23 AMby Gary Grosschadl
For the first time this summer, the price of gold is back above $410 and gold bugs are hopeful of a good move developing.
Position: Buy
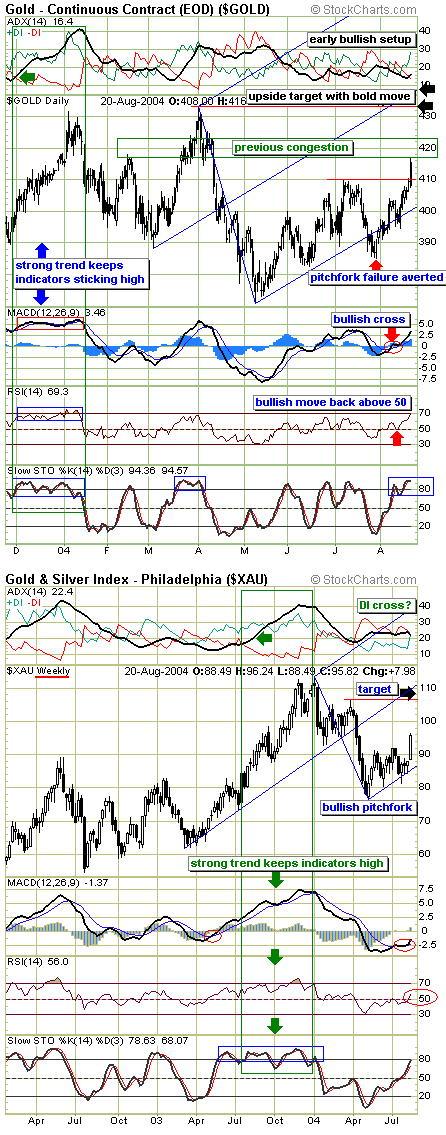
| In Friday's trading session, the daily gold price (as measured by end of day, continuous contract) shot up $6.10 to close at $415.50. This is a move above previous resistance at $410 and so has caught the attention of many. |
| Using an Andrews pitchfork, some perspective is gained. Three previous turning points were chosen to anchor the pitchfork. This shows a bullish pointing pitchfork that was briefly violated to the downside in late July. This pointed at a possible bearish trend change but this was quickly averted as the price improved to move back above the lower median line. Now with this move above $410 resistance, the pitchfork shows a possible upside target at the median line which is just above the previous high mark of $433. One of the main features of pitchfork theory is that a valid pattern has a move to the median line. |

|
| Two gold charts showing bullish promise, the top being a daily chart of the gold price followed by a weekly index chart. |
| Graphic provided by: Stockcharts.com. |
| |
| Several indicators seem to support this view. The directional movement indicator at the top of the chart is comprised of three elements: an ADX and two DIs. An early bullish setup is indicated as the ADX (trend strength component) has just moved between the DIs with +DI on top. Ideally the ADX should show a healthy upslope and rise above 20. Looking at the extreme left of the chart, a similar "early" setup is shown as indicated by the green arrow on the ADX graph. Should similar mechanics develop, then a sizable bullish move up can occur. The two lower indicators (relative strength index or RSI and stochastics) both show high levels which can be interpreted as being overbought. Looking back at last December, traders are reminded that if a strong trend develops, then these indicators can "stick high" for an extended time, prolonging the upmove. |
| The second chart shown is the weekly chart of the Gold and Silver index or XAU. This also reflects the bullishness seen on the gold price chart. Again a bullish pointing pitchfork is shown but this time there was no violation of the fork's lower median line (on a weekly closing basis). An upside target is suggested between the previous high mark and the median line (106-110). The same indicators on this chart are also looking bullish. The top graph shows a possible DI reversal which would shift power from the bears to the bulls. The ADX line would then have to upslope to add confirmation of a strong trend developing. The MACD (moving average convergence/divergence) and the RSI (relative strength index) both show some upside room while the stochastics soon reaching overbought levels. As before, a case can be argued for a strong trend (if it develops) can keep several indicators "sticking high." |
| Realistically both of these charts also suggest that a move up to previous congestion levels could result in a somewhat delayed move to the upside targets indicated on the charts. The gold markets are often hard to read with many stalls and reversals taking place. Traders should exercise caution and patience, this being a bit of a balancing act at times as this move unfolds over the coming weeks. |
Independent Canadian equities trader and technical analyst based in Peterborough
Ontario, Canada.
| Website: | www.whatsonsale.ca/financial.html |
| E-mail address: | gwg7@sympatico.ca |
Click here for more information about our publications!
Comments
Date: 08/24/04Rank: 4Comment:
Date: 08/24/04Rank: 5Comment:

|

Request Information From Our Sponsors
- StockCharts.com, Inc.
- Candle Patterns
- Candlestick Charting Explained
- Intermarket Technical Analysis
- John Murphy on Chart Analysis
- John Murphy's Chart Pattern Recognition
- John Murphy's Market Message
- MurphyExplainsMarketAnalysis-Intermarket Analysis
- MurphyExplainsMarketAnalysis-Visual Analysis
- StockCharts.com
- Technical Analysis of the Financial Markets
- The Visual Investor
- VectorVest, Inc.
- Executive Premier Workshop
- One-Day Options Course
- OptionsPro
- Retirement Income Workshop
- Sure-Fire Trading Systems (VectorVest, Inc.)
- Trading as a Business Workshop
- VectorVest 7 EOD
- VectorVest 7 RealTime/IntraDay
- VectorVest AutoTester
- VectorVest Educational Services
- VectorVest OnLine
- VectorVest Options Analyzer
- VectorVest ProGraphics v6.0
- VectorVest ProTrader 7
- VectorVest RealTime Derby Tool
- VectorVest Simulator
- VectorVest Variator
- VectorVest Watchdog
