HOT TOPICS LIST
- MACD
- Fibonacci
- RSI
- Gann
- ADXR
- Stochastics
- Volume
- Triangles
- Futures
- Cycles
- Volatility
- ZIGZAG
- MESA
- Retracement
- Aroon
INDICATORS LIST
LIST OF TOPICS
PRINT THIS ARTICLE
by Kevin Hopson
A break of short-term resistance last week may have confirmed a bottom reversal in FuelCell Energy.
Position: N/A
Kevin Hopson
Kevin has been a technical analyst for roughly 10 years now. Previously, Kevin owned his own business and acted as a registered investment advisor, specializing in energy. He was also a freelance oil analyst for Orient Trading Co., a commodity futures trading firm in Japan. Kevin is currently a freelance writer.
PRINT THIS ARTICLE
TECHNICAL ANALYSIS
FuelCell Energy Showing Signs Of Bottoming Out
08/23/04 09:38:45 AMby Kevin Hopson
A break of short-term resistance last week may have confirmed a bottom reversal in FuelCell Energy.
Position: N/A
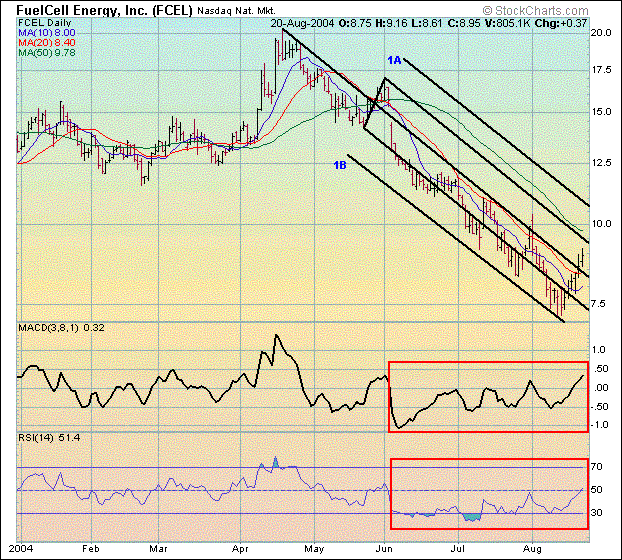
| FuelCell Energy, Inc. (FCEL) has been in a strong downtrend since mid-April, when the stock topped out around the $20.00 level. However, over the last two-and-a-half months, FuelCell has been showing bullish divergences on the daily chart. Notice how the moving average convergence/divergence (MACD) has been moving sideways to slightly higher since early June, while the stock price has continued to trade lower. Additionally, the relative strength index (RSI) has been showing similar action since early July. These positive divergences are often a sign of a forthcoming bottom. |
| Unfortunately, it is difficult to predict when bottom reversals will occur in this situation, and divergences can stretch out for many months (or even years). This is why it is important to look at other elements of the chart. For example, notice how prices had been stuck between the median line of the black pitchfork and the 1B channel line until late last week. Because FuelCell recently breached the black median line and its 10-day and 20-day moving averages, which had acted as resistance for nearly three months, the stock has likely put in a short-term bottom - if not a significant bottom. |

|
| Graphic provided by: Stockcharts.com. |
| |
| If so, the next upside target appears to be the $9.50 to $9.80 range, which is the site of the stock's 50-day moving average ($9.78) and the top parallel line of the black pitchfork. If FuelCell can take out further resistance here, it will likely indicate a significant bottom in the stock price. Since short interest for the stock remains high at 6.5M shares (or roughly 6.5x average daily volume), there is plenty of potential buying pressure to push FuelCell higher in the near-term. As a result, investors with a high risk, high reward mentality might consider buying on weakness. |
Kevin has been a technical analyst for roughly 10 years now. Previously, Kevin owned his own business and acted as a registered investment advisor, specializing in energy. He was also a freelance oil analyst for Orient Trading Co., a commodity futures trading firm in Japan. Kevin is currently a freelance writer.
| Glen Allen, VA | |
| E-mail address: | hopson_1@yahoo.com |
Click here for more information about our publications!
Comments
Date: 08/24/04Rank: 3Comment:
Date: 08/24/04Rank: 4Comment:

Request Information From Our Sponsors
- StockCharts.com, Inc.
- Candle Patterns
- Candlestick Charting Explained
- Intermarket Technical Analysis
- John Murphy on Chart Analysis
- John Murphy's Chart Pattern Recognition
- John Murphy's Market Message
- MurphyExplainsMarketAnalysis-Intermarket Analysis
- MurphyExplainsMarketAnalysis-Visual Analysis
- StockCharts.com
- Technical Analysis of the Financial Markets
- The Visual Investor
- VectorVest, Inc.
- Executive Premier Workshop
- One-Day Options Course
- OptionsPro
- Retirement Income Workshop
- Sure-Fire Trading Systems (VectorVest, Inc.)
- Trading as a Business Workshop
- VectorVest 7 EOD
- VectorVest 7 RealTime/IntraDay
- VectorVest AutoTester
- VectorVest Educational Services
- VectorVest OnLine
- VectorVest Options Analyzer
- VectorVest ProGraphics v6.0
- VectorVest ProTrader 7
- VectorVest RealTime Derby Tool
- VectorVest Simulator
- VectorVest Variator
- VectorVest Watchdog
