HOT TOPICS LIST
- MACD
- Fibonacci
- RSI
- Gann
- ADXR
- Stochastics
- Volume
- Triangles
- Futures
- Cycles
- Volatility
- ZIGZAG
- MESA
- Retracement
- Aroon
INDICATORS LIST
LIST OF TOPICS
PRINT THIS ARTICLE
by David Penn
What do you do when a pattern absolutely, positively has to be a reversal?
Position: N/A
David Penn
Technical Writer for Technical Analysis of STOCKS & COMMODITIES magazine, Working-Money.com, and Traders.com Advantage.
PRINT THIS ARTICLE
HEAD & SHOULDERS
Fedex's Hourly Head And Shoulders Top
08/20/04 02:04:06 PMby David Penn
What do you do when a pattern absolutely, positively has to be a reversal?
Position: N/A
| Is FedEx a shipping company, a verb, a stock tempting fate with recent price action that comes perilously close to resembling a head and shoulders top -- or all of the above? |
| I started paying more attention to hourly charts after reading that many pre-WWII technical analysts used to keep track of the hour-to-hour changes in the Averages as a way of maintaining a finger on the pulse of the markets. As important as daily charts are for spotting swing trading set-ups that might last anywhere from one to five days, hourly charts can truly help traders anticipate those daily-based opportunities. |

|
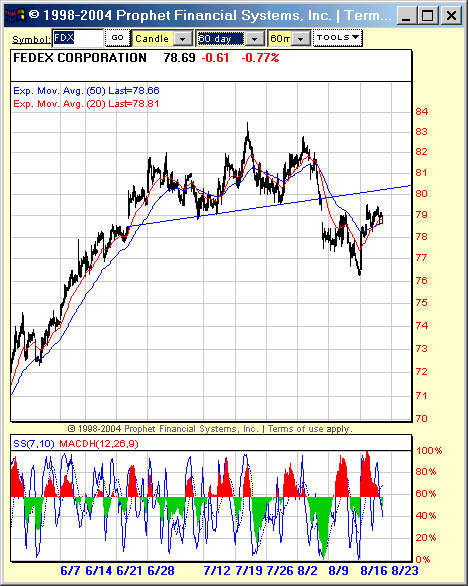
| This head and shoulders chart in the 60-minute FDX suggests that the shipper still has room to go on the downside. |
| Graphic provided by: Prophet Financial Systems, Inc. |
| |
| Hourly charts also let swing traders play "position trader," utilizing techniques like 1-2-3 trend reversals and 2B top and bottom tests to help pinpoint optimal entries for short-term trading. |
| But back to FedEx, while many other stocks were breaking down over the summer of 2004, FedEx remained resilient. As just one example, consider that shares of FedEx are up nearly 15% for the year as of this writing, while all the major averages are down. Nevertheless, FedEx has been putting in topping action since late June/early July and the lower peak in late July seems to have been the last advance of this particular bull move. This "right shoulder" was completed in a few blisteringly bearish sessions, sending the price of FDX through neckline support at about 80. |
| Given a formation size of about five points (roughly 83.5 to 78.5) and neckline support at 80, traders can look forward to an initial decline to about 73. It is at these levels also where some support begins to appear in the form of the June lows. Currently bouncing after initially breaking free from the pattern, shares of FDX might actually be providing another entry point for short-oriented traders. |
Technical Writer for Technical Analysis of STOCKS & COMMODITIES magazine, Working-Money.com, and Traders.com Advantage.
| Title: | Technical Writer |
| Company: | Technical Analysis, Inc. |
| Address: | 4757 California Avenue SW |
| Seattle, WA 98116 | |
| Phone # for sales: | 206 938 0570 |
| Fax: | 206 938 1307 |
| Website: | www.Traders.com |
| E-mail address: | DPenn@traders.com |
Traders' Resource Links | |
| Charting the Stock Market: The Wyckoff Method -- Books | |
| Working-Money.com -- Online Trading Services | |
| Traders.com Advantage -- Online Trading Services | |
| Technical Analysis of Stocks & Commodities -- Publications and Newsletters | |
| Working Money, at Working-Money.com -- Publications and Newsletters | |
| Traders.com Advantage -- Publications and Newsletters | |
| Professional Traders Starter Kit -- Software | |
Click here for more information about our publications!
Comments
Date: 08/24/04Rank: 4Comment:

|

Request Information From Our Sponsors
- StockCharts.com, Inc.
- Candle Patterns
- Candlestick Charting Explained
- Intermarket Technical Analysis
- John Murphy on Chart Analysis
- John Murphy's Chart Pattern Recognition
- John Murphy's Market Message
- MurphyExplainsMarketAnalysis-Intermarket Analysis
- MurphyExplainsMarketAnalysis-Visual Analysis
- StockCharts.com
- Technical Analysis of the Financial Markets
- The Visual Investor
- VectorVest, Inc.
- Executive Premier Workshop
- One-Day Options Course
- OptionsPro
- Retirement Income Workshop
- Sure-Fire Trading Systems (VectorVest, Inc.)
- Trading as a Business Workshop
- VectorVest 7 EOD
- VectorVest 7 RealTime/IntraDay
- VectorVest AutoTester
- VectorVest Educational Services
- VectorVest OnLine
- VectorVest Options Analyzer
- VectorVest ProGraphics v6.0
- VectorVest ProTrader 7
- VectorVest RealTime Derby Tool
- VectorVest Simulator
- VectorVest Variator
- VectorVest Watchdog
