HOT TOPICS LIST
- MACD
- Fibonacci
- RSI
- Gann
- ADXR
- Stochastics
- Volume
- Triangles
- Futures
- Cycles
- Volatility
- ZIGZAG
- MESA
- Retracement
- Aroon
INDICATORS LIST
LIST OF TOPICS
PRINT THIS ARTICLE
by David Penn
How much of a surprise was the August 16th "surprise" rally?
Position: N/A
David Penn
Technical Writer for Technical Analysis of STOCKS & COMMODITIES magazine, Working-Money.com, and Traders.com Advantage.
PRINT THIS ARTICLE
REVERSAL
If On An Intraday Correction A Divergence ...
08/19/04 01:21:59 PMby David Penn
How much of a surprise was the August 16th "surprise" rally?
Position: N/A
| With every rally in the market being attributed to dips in the otherwise ever-advancing price of crude oil, it is of no surprise that the sharp rally in the markets on Monday, August 16 was believed to be similarly indebted to the oil bulls. Yet, the fact of the matter is that traders should have had a sign that the market might move higher on Monday -- regardless of the vagaries of crude oil. Before characterizing this "false" rally, let's take a look at the set (or set-up) that would have gotten traders long Monday morning just as the market was taking off in earnest. |
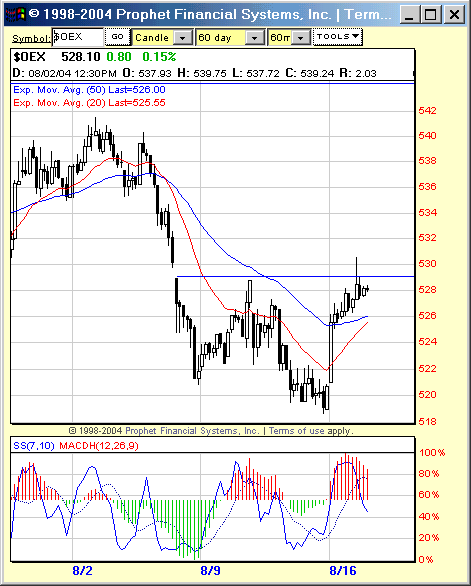
| I use a number of tools -- from moving averages to Elliott wave theory -- to look at the markets. In this case, however, let's look at two of my favorites: the MACD histogram (or MACDH) and the 7,10 stochastic. Here, on the hourly chart of the $OEX on Friday going into Monday, a clear bottom, of sorts, developed. |

|
| Figure 1: A positive divergence between price and the 7,10 stochastic near the end of trading on Friday, August 13th helped provide an entry point to the long side on Monday. |
| Graphic provided by: Prophet Financial Systems, Inc. |
| |
| What was most exciting about this bottom is that it created two sets of positive divergences! The larger positive divergence between price action and the 7,10 stochastic comes in comparing the consecutively lower price troughs on Friday, August 6th and Friday, August 13th, with the consecutively higher stochastic troughs of those same two days. This alone suggested that the market was looking to move higher. However, if you look closely at the Friday, August 13th bottom, you might notice another set of positive divergences. Here, note the low on the 12th and the lower low on the 13th (in price), with the stochastic low on the 12th and the higher low on the 13th. Again, this kind of positive divergence is exceptionally bullish. How would an entry signal have been generated? Here is where I turn to the MACDH. |
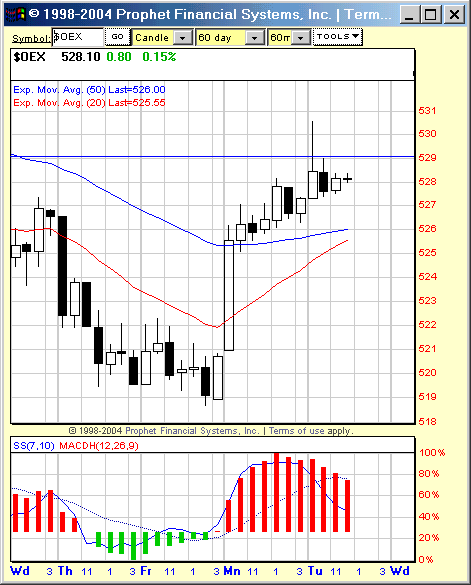
 Figure 2: When the MACDH ticked upward in the final hour of the day (after ticking downward in the penultimate hour), a divergence-long entry signal was generated. Note how, in the second to last hour of trading, the MACDH ticked downward (shown as the final green bar in the MACDH). The positive divergence was brewing, but I need to see the MACDH make a positive tick upwards in order to both confirm the trade AND to provide an entry target. Fortunately, the MACDH did indeed tick upward (shown as the first red bar in the MACDH after the series of green bars). This would tell me that I have a divergence-long opportunity. But what is my entry? Typically, I take the "confirming bar," divide its range in half and add that value to the high of the confirming bar. Again, the confirming bar is the bar during which the MACDH made the key tick upward (or downward). |
| In this case, that confirming bar was in the final hour of trading on Friday. With a range of 1.93 and a high of 520.84, the entry point would have been at about 521.81. Given that we are looking at the $OEX, a trader could have planned to buy August calls with 520 or 525 strikes on Monday morning if that 521.81 level was reached. Of course, as we know, the 521.81 level was reached quite quickly on Monday morning. In fact, by the end of the first hour of trading, both the 520 as well as the 525 August calls would have been in the money. Many traders caution endlessly about the dangers of bottom and top-picking. This is not entirely without good reason. But traders are better off figuring out what works best for themselves, as opposed to merely following the tenets and shibboleths of another trader. It still remains that a number of exceptionally successful traders -- from Paul Tudor Jones to Victor Sperandeo -- have put a few coins in their pockets by selling tops and buying bottoms. With the right discipline, the right tools, and the right attitude, could not other less star-studded traders do the same? |
Technical Writer for Technical Analysis of STOCKS & COMMODITIES magazine, Working-Money.com, and Traders.com Advantage.
| Title: | Technical Writer |
| Company: | Technical Analysis, Inc. |
| Address: | 4757 California Avenue SW |
| Seattle, WA 98116 | |
| Phone # for sales: | 206 938 0570 |
| Fax: | 206 938 1307 |
| Website: | www.Traders.com |
| E-mail address: | DPenn@traders.com |
Traders' Resource Links | |
| Charting the Stock Market: The Wyckoff Method -- Books | |
| Working-Money.com -- Online Trading Services | |
| Traders.com Advantage -- Online Trading Services | |
| Technical Analysis of Stocks & Commodities -- Publications and Newsletters | |
| Working Money, at Working-Money.com -- Publications and Newsletters | |
| Traders.com Advantage -- Publications and Newsletters | |
| Professional Traders Starter Kit -- Software | |
Click here for more information about our publications!
Comments
Date: 08/19/04Rank: 5Comment:
Date: 08/19/04Rank: 3Comment:

Request Information From Our Sponsors
- StockCharts.com, Inc.
- Candle Patterns
- Candlestick Charting Explained
- Intermarket Technical Analysis
- John Murphy on Chart Analysis
- John Murphy's Chart Pattern Recognition
- John Murphy's Market Message
- MurphyExplainsMarketAnalysis-Intermarket Analysis
- MurphyExplainsMarketAnalysis-Visual Analysis
- StockCharts.com
- Technical Analysis of the Financial Markets
- The Visual Investor
- VectorVest, Inc.
- Executive Premier Workshop
- One-Day Options Course
- OptionsPro
- Retirement Income Workshop
- Sure-Fire Trading Systems (VectorVest, Inc.)
- Trading as a Business Workshop
- VectorVest 7 EOD
- VectorVest 7 RealTime/IntraDay
- VectorVest AutoTester
- VectorVest Educational Services
- VectorVest OnLine
- VectorVest Options Analyzer
- VectorVest ProGraphics v6.0
- VectorVest ProTrader 7
- VectorVest RealTime Derby Tool
- VectorVest Simulator
- VectorVest Variator
- VectorVest Watchdog
