

HOT TOPICS LIST
- MACD
- Fibonacci
- RSI
- Gann
- ADXR
- Stochastics
- Volume
- Triangles
- Futures
- Cycles
- Volatility
- ZIGZAG
- MESA
- Retracement
- Aroon
INDICATORS LIST
LIST OF TOPICS
PRINT THIS ARTICLE
by Arthur Hill
A recent recovery and PnF breakout point to higher prices down the road for UnumProvident.
Position: Buy
Arthur Hill
Arthur Hill is currently editor of TDTrader.com, a website specializing in trading strategies, sector/industry specific breadth stats and overall technical analysis. He passed the Society of Technical Analysts (STA London) diploma exam with distinction is a Certified Financial Technician (CFTe). Prior to TD Trader, he was the Chief Technical Analyst for Stockcharts.com and the main contributor to the ChartSchool.
PRINT THIS ARTICLE
POINT & FIGURE
UnumProvident Breaks Triple Top
08/17/04 11:09:25 AMby Arthur Hill
A recent recovery and PnF breakout point to higher prices down the road for UnumProvident.
Position: Buy
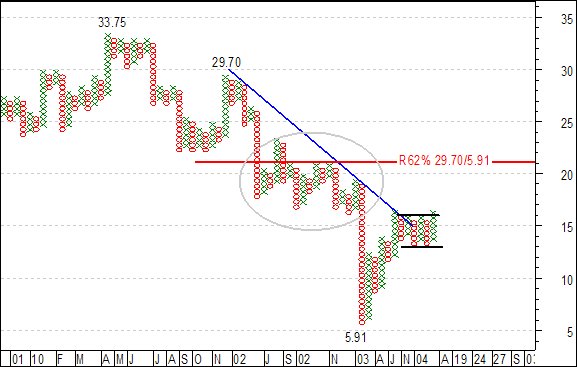 Figure 1: Longer term point & figure chart of UnumProvident. As the large point & figure chart shows, UnumProvident (UNM) declined from 33.75 to 5.91 over the last few years (May-01 to Mar-03). The stock rebounded with the overall market in 2003 and then formed a trading range from Nov-03 to July-4. The Aug-04 trading range breakout forged a point & figure buy signal and opens the door to further gains. |
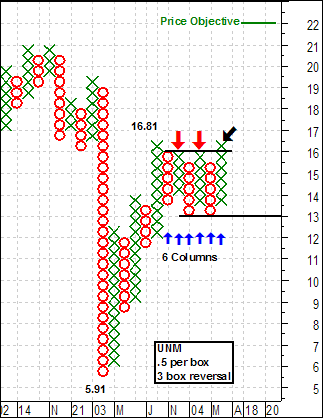
| The point & figure buy signal is a Triple Top Breakout. After the advance from 5.91 to 16.81, the stock formed a trading range with resistance at 16 and support at 13. UNM tried twice to break above 16 and failed (red arrows). The third attempt succeeded and this forged a triple top buy signal (black arrow). |
|
| Figure 2: Triple top breakout for UNM. |
| Graphic provided by: MetaStock. |
| |
| The upside projection is to the low 20s. Using the Bullish Horizontal Count method, the price objective is 22 ((6 x 3) x .50 = 9). The width of the pattern (6 columns) is multiplied by the reversal amount (3 boxes) and this product is multiplied by the box size (.50). This amount is then added to the bottom of the consolidation (13 + 9 = 22) to project a price objective. Looking back at the larger chart, a 62% retracement of the prior decline (29.70 to 5.91) confirms this upside target in the low 20s. As long as support at 13 holds, the breakout and price objectives are valid. |
Arthur Hill is currently editor of TDTrader.com, a website specializing in trading strategies, sector/industry specific breadth stats and overall technical analysis. He passed the Society of Technical Analysts (STA London) diploma exam with distinction is a Certified Financial Technician (CFTe). Prior to TD Trader, he was the Chief Technical Analyst for Stockcharts.com and the main contributor to the ChartSchool.
| Title: | Editor |
| Company: | TDTrader.com |
| Address: | Willem Geetsstraat 17 |
| Mechelen, B2800 | |
| Phone # for sales: | 3215345465 |
| Website: | www.tdtrader.com |
| E-mail address: | arthurh@tdtrader.com |
Traders' Resource Links | |
| TDTrader.com has not added any product or service information to TRADERS' RESOURCE. | |
Click here for more information about our publications!
Comments
Date:�08/19/04Rank:�1Comment:�
Date:�04/29/08Rank:�5Comment:�

Request Information From Our Sponsors
- StockCharts.com, Inc.
- Candle Patterns
- Candlestick Charting Explained
- Intermarket Technical Analysis
- John Murphy on Chart Analysis
- John Murphy's Chart Pattern Recognition
- John Murphy's Market Message
- MurphyExplainsMarketAnalysis-Intermarket Analysis
- MurphyExplainsMarketAnalysis-Visual Analysis
- StockCharts.com
- Technical Analysis of the Financial Markets
- The Visual Investor
- VectorVest, Inc.
- Executive Premier Workshop
- One-Day Options Course
- OptionsPro
- Retirement Income Workshop
- Sure-Fire Trading Systems (VectorVest, Inc.)
- Trading as a Business Workshop
- VectorVest 7 EOD
- VectorVest 7 RealTime/IntraDay
- VectorVest AutoTester
- VectorVest Educational Services
- VectorVest OnLine
- VectorVest Options Analyzer
- VectorVest ProGraphics v6.0
- VectorVest ProTrader 7
- VectorVest RealTime Derby Tool
- VectorVest Simulator
- VectorVest Variator
- VectorVest Watchdog