HOT TOPICS LIST
- MACD
- Fibonacci
- RSI
- Gann
- ADXR
- Stochastics
- Volume
- Triangles
- Futures
- Cycles
- Volatility
- ZIGZAG
- MESA
- Retracement
- Aroon
INDICATORS LIST
LIST OF TOPICS
PRINT THIS ARTICLE
by Arthur Hill
Small cap stocks, which led the market higher in 2003, are testing an important support level that could hold the key to the overall market.
Position: N/A
Arthur Hill
Arthur Hill is currently editor of TDTrader.com, a website specializing in trading strategies, sector/industry specific breadth stats and overall technical analysis. He passed the Society of Technical Analysts (STA London) diploma exam with distinction is a Certified Financial Technician (CFTe). Prior to TD Trader, he was the Chief Technical Analyst for Stockcharts.com and the main contributor to the ChartSchool.
PRINT THIS ARTICLE
POINT & FIGURE
Small Caps Testing Important Support
08/17/04 11:05:02 AMby Arthur Hill
Small cap stocks, which led the market higher in 2003, are testing an important support level that could hold the key to the overall market.
Position: N/A
| Even though a point & figure chart is used in this analysis, traditional pattern analysis still applies. Double tops/bottom, rising/falling wedges, triangles and other patterns can be identified just as easily. In addition, targets and retracements are just as valid. Point & figure charts simply filter out the noise by focusing on price reversals without regard to elapsed time. |
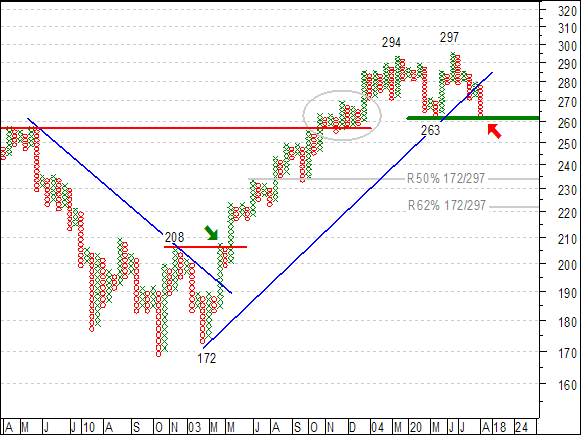
| The overall trend for the S&P SmallCap Index (SML) is clearly up, but this up trend is also getting its biggest challenge since it began in April 2003. Notice that the uptrend began with a trendline break and resistance break in April 2003 (green arrow). The advance then worked its way higher until Apr-04 (294) and formed a reaction low in May-04 (263). This reaction low is to the uptrend what the reaction high at 208 was to the downtrend. The higher high at 172, trendline break and higher high above 208 unequivocally changed the trend in April 2003. |

|
| Graphic provided by: MetaStock. |
| |
| As the chart now stands, the index formed a higher high at 297, broke the trendline extending up from 172 and is challenging the May low at 263. So far, only the trendline break is negative and not enough to call for a bearish reversal. As long as support holds, the bulls have the benefit of the doubt. A move below 263 would make for a lower low and clearly show that the bears have gained the upper hand. As a confirmed double top, the projected decline would be to around 230 (297 - 263 = 34, 263 - 34 = 229). This target also corresponds to a 50-62% retracement of the prior advance (172 to 297). |
Arthur Hill is currently editor of TDTrader.com, a website specializing in trading strategies, sector/industry specific breadth stats and overall technical analysis. He passed the Society of Technical Analysts (STA London) diploma exam with distinction is a Certified Financial Technician (CFTe). Prior to TD Trader, he was the Chief Technical Analyst for Stockcharts.com and the main contributor to the ChartSchool.
| Title: | Editor |
| Company: | TDTrader.com |
| Address: | Willem Geetsstraat 17 |
| Mechelen, B2800 | |
| Phone # for sales: | 3215345465 |
| Website: | www.tdtrader.com |
| E-mail address: | arthurh@tdtrader.com |
Traders' Resource Links | |
| TDTrader.com has not added any product or service information to TRADERS' RESOURCE. | |
Click here for more information about our publications!
Comments
Date: 08/19/04Rank: 5Comment:
Date: 04/29/08Rank: 5Comment:

Request Information From Our Sponsors
- StockCharts.com, Inc.
- Candle Patterns
- Candlestick Charting Explained
- Intermarket Technical Analysis
- John Murphy on Chart Analysis
- John Murphy's Chart Pattern Recognition
- John Murphy's Market Message
- MurphyExplainsMarketAnalysis-Intermarket Analysis
- MurphyExplainsMarketAnalysis-Visual Analysis
- StockCharts.com
- Technical Analysis of the Financial Markets
- The Visual Investor
- VectorVest, Inc.
- Executive Premier Workshop
- One-Day Options Course
- OptionsPro
- Retirement Income Workshop
- Sure-Fire Trading Systems (VectorVest, Inc.)
- Trading as a Business Workshop
- VectorVest 7 EOD
- VectorVest 7 RealTime/IntraDay
- VectorVest AutoTester
- VectorVest Educational Services
- VectorVest OnLine
- VectorVest Options Analyzer
- VectorVest ProGraphics v6.0
- VectorVest ProTrader 7
- VectorVest RealTime Derby Tool
- VectorVest Simulator
- VectorVest Variator
- VectorVest Watchdog
