HOT TOPICS LIST
- MACD
- Fibonacci
- RSI
- Gann
- ADXR
- Stochastics
- Volume
- Triangles
- Futures
- Cycles
- Volatility
- ZIGZAG
- MESA
- Retracement
- Aroon
INDICATORS LIST
LIST OF TOPICS
PRINT THIS ARTICLE
by Kevin Hopson
The precious metal bullish percent continues to hover below the 30 percent level. As such, the sector has yet to give a buy signal.
Position: Hold
Kevin Hopson
Kevin has been a technical analyst for roughly 10 years now. Previously, Kevin owned his own business and acted as a registered investment advisor, specializing in energy. He was also a freelance oil analyst for Orient Trading Co., a commodity futures trading firm in Japan. Kevin is currently a freelance writer.
PRINT THIS ARTICLE
TECHNICAL ANALYSIS
An Update On The Precious Metal Bullish Percent
08/17/04 10:50:52 AMby Kevin Hopson
The precious metal bullish percent continues to hover below the 30 percent level. As such, the sector has yet to give a buy signal.
Position: Hold
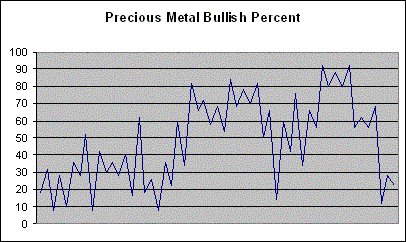
| I last touched on the precious metal bullish percent in early June. At that time, I said the sector was significantly oversold and that a move above the 30 percent level would be a signal to buy. Since then, the bullish percent has topped out around the 28 percent level (in July) and started to pull back again. As a result, we have yet to see confirmation of a new bull market in precious metals. |
| To recap my prior article, the bullish percent measures the number of stocks that are currently on point and figure buy signals. When prices exceed a prior high, a buy signal is given, and vice-versa. Because of this, the bullish percent tends to be an excellent contrarian indicator -- when the bullish percent is above 70, prices are overbought. When the bullish percent is below 30, prices are oversold. Obviously, prices can become more overbought or more oversold so it is important to watch certain setups before making a decision on whether to buy or sell. |

|
| Figure 1: Bulllish Percent of Rydex Precious Metals Fund. |
| Graphic provided by: Excel Spreadsheet. |
| |
| Currently, the precious metal sector is in a confirmed bear market. However, if the bullish percent were to reverse from current levels (22 percent) and hit 28 percent, the sector would be in "Bull Alert" status. It would then take a break over July's high (28 percent) and a further move above the 30 percent level for the sector to give a "Bull Confirmed" buy signal. When this occurs, it will be an excellent time to go long precious metal stocks. |
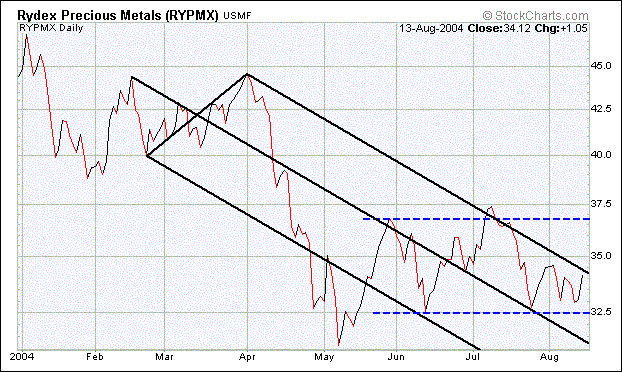
 Figure 2: Daily chart of Rydex Precious Metals Fund. Graphic provided by: Stockcharts.com One sector fund I like is the Rydex Precious Metals Fund (RYPMX). Looking at the year-to-date chart, you will notice that prices have been contained within the falling black pitchfork since late May. Additionally, the fund looks to have formed a trading range off of May's bottom, as illustrated by the dotted blue lines. A move above the top black parallel line and an upside break of the current trading range would be very positive from a technical standpoint. If the fund can eventually overcome these resistance levels and the bullish percent can give a confirming buy signal in the process, I would go long RYPMX. Until then, I would remain on the sidelines and only look to buy if I were positioning myself for the long-term. |
Kevin has been a technical analyst for roughly 10 years now. Previously, Kevin owned his own business and acted as a registered investment advisor, specializing in energy. He was also a freelance oil analyst for Orient Trading Co., a commodity futures trading firm in Japan. Kevin is currently a freelance writer.
| Glen Allen, VA | |
| E-mail address: | hopson_1@yahoo.com |
Click here for more information about our publications!
Comments
Date: 08/19/04Rank: 4Comment:

|

Request Information From Our Sponsors
- StockCharts.com, Inc.
- Candle Patterns
- Candlestick Charting Explained
- Intermarket Technical Analysis
- John Murphy on Chart Analysis
- John Murphy's Chart Pattern Recognition
- John Murphy's Market Message
- MurphyExplainsMarketAnalysis-Intermarket Analysis
- MurphyExplainsMarketAnalysis-Visual Analysis
- StockCharts.com
- Technical Analysis of the Financial Markets
- The Visual Investor
- VectorVest, Inc.
- Executive Premier Workshop
- One-Day Options Course
- OptionsPro
- Retirement Income Workshop
- Sure-Fire Trading Systems (VectorVest, Inc.)
- Trading as a Business Workshop
- VectorVest 7 EOD
- VectorVest 7 RealTime/IntraDay
- VectorVest AutoTester
- VectorVest Educational Services
- VectorVest OnLine
- VectorVest Options Analyzer
- VectorVest ProGraphics v6.0
- VectorVest ProTrader 7
- VectorVest RealTime Derby Tool
- VectorVest Simulator
- VectorVest Variator
- VectorVest Watchdog
