HOT TOPICS LIST
- MACD
- Fibonacci
- RSI
- Gann
- ADXR
- Stochastics
- Volume
- Triangles
- Futures
- Cycles
- Volatility
- ZIGZAG
- MESA
- Retracement
- Aroon
INDICATORS LIST
LIST OF TOPICS
PRINT THIS ARTICLE
by Gary Grosschadl
Many gold stocks are looking anemic but this Canadian gold company is due for an upleg attempt as suggested by this chart.
Position: Buy
Gary Grosschadl
Independent Canadian equities trader and technical analyst based in Peterborough
Ontario, Canada.
PRINT THIS ARTICLE
CHART ANALYSIS
Gold Stock Looking To Bounce
08/18/04 11:20:36 AMby Gary Grosschadl
Many gold stocks are looking anemic but this Canadian gold company is due for an upleg attempt as suggested by this chart.
Position: Buy
| Bema Gold Corp. (BGO.TO) is a gold exploration and mining company with producing mines in Russia and South Africa, and is developing projects in Chile and Russia. Gold prices are off their previous $430 highs and have been ranging between $385 to $410 for the past several months. Many gold stock charts do not look very promising but this one caught my eye. Bema has a history of being a good trader with good liquidity when the gold marktets are running. Perhaps it is reflecting early promise of the next gold upleg. |
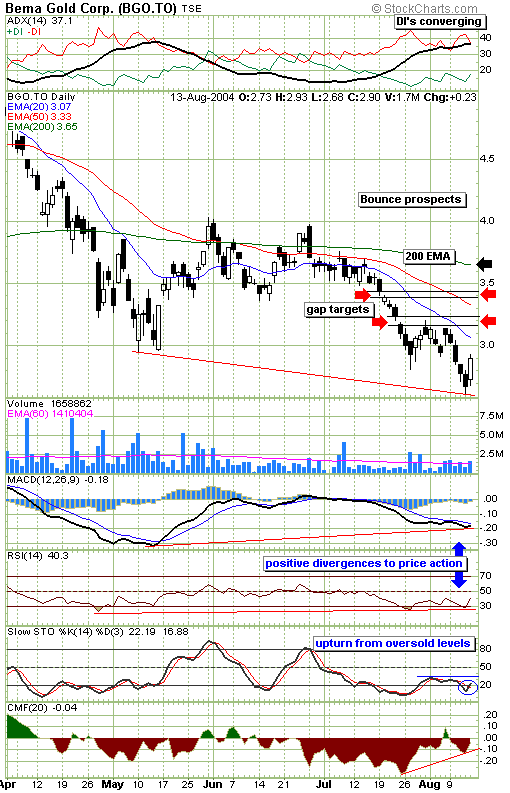
| After a downdraft of five black candlesticks, the bullish candle from last Friday hints at some kind of bounce coming. A look at some indicators provides a reasonable prospect of this ocurring. The strongest signs are the multiple positive divergences to price action. As the stock price has weakened to set new lows, some of my favorite key indicators have refused to follow. The MACD (moving average convergence/divergence) and the RSI (relative strength index) have not set new lows, thereby showing latent bullishness. The stochastics indicator shows a hopeful upturn from oversold levels but needs to rise above the previous stall point. Also showing an early stage bullish development is the directional movement indicator at the top of the chart. Both DIs are converging, which is the first step towards a possible crossing of these lines, giving bullish forces an eventual upper hand if this current move continues. |

|
| Possible short-term trading targets are shown on this daily chart. |
| Graphic provided by: Stockcharts.com. |
| |
| Should a tradeable bounce ensue, this daily chart hints at possible upside targets shown by the arrows. Previous gaps often provide important support or resistance levels and these two gaps may be upside targets for the short-term trader. The first test however will be the 20-day EMA, currently at $3.07. Stocks in a declining trend often have failure moves that are repulsed by this overhead moving average. Should the bulls run the stock past these upside gaps, the more optimistic target would be the often important 200-day exponential moving average. This area around $3.65 also represents a wide area of previous congestion. The CMF or Chaiken money flow indicator also shows a shorter term positive divergence, which also suggests a bounce attempt. |
| While some sort of bounce is suggested here, possible upside targets are meant for the short-term trader. These are "failure" moves targeting overhead resistance as it is too soon to muse over an actual longer term trend change. A series of higher highs and higher lows over the next few weeks or months would be needed before arguing any trend change. |
Independent Canadian equities trader and technical analyst based in Peterborough
Ontario, Canada.
| Website: | www.whatsonsale.ca/financial.html |
| E-mail address: | gwg7@sympatico.ca |
Click here for more information about our publications!
Comments
Date: 08/19/04Rank: 5Comment:
Date: 08/24/04Rank: 5Comment:

Request Information From Our Sponsors
- StockCharts.com, Inc.
- Candle Patterns
- Candlestick Charting Explained
- Intermarket Technical Analysis
- John Murphy on Chart Analysis
- John Murphy's Chart Pattern Recognition
- John Murphy's Market Message
- MurphyExplainsMarketAnalysis-Intermarket Analysis
- MurphyExplainsMarketAnalysis-Visual Analysis
- StockCharts.com
- Technical Analysis of the Financial Markets
- The Visual Investor
- VectorVest, Inc.
- Executive Premier Workshop
- One-Day Options Course
- OptionsPro
- Retirement Income Workshop
- Sure-Fire Trading Systems (VectorVest, Inc.)
- Trading as a Business Workshop
- VectorVest 7 EOD
- VectorVest 7 RealTime/IntraDay
- VectorVest AutoTester
- VectorVest Educational Services
- VectorVest OnLine
- VectorVest Options Analyzer
- VectorVest ProGraphics v6.0
- VectorVest ProTrader 7
- VectorVest RealTime Derby Tool
- VectorVest Simulator
- VectorVest Variator
- VectorVest Watchdog
