HOT TOPICS LIST
- MACD
- Fibonacci
- RSI
- Gann
- ADXR
- Stochastics
- Volume
- Triangles
- Futures
- Cycles
- Volatility
- ZIGZAG
- MESA
- Retracement
- Aroon
INDICATORS LIST
LIST OF TOPICS
PRINT THIS ARTICLE
by David Penn
Does the diamond top in Lincoln National anticipate broader weakness through the insurance industry?
Position: N/A
David Penn
Technical Writer for Technical Analysis of STOCKS & COMMODITIES magazine, Working-Money.com, and Traders.com Advantage.
PRINT THIS ARTICLE
THE DIAMOND
The Diamond In Lincoln National
08/16/04 11:02:20 AMby David Penn
Does the diamond top in Lincoln National anticipate broader weakness through the insurance industry?
Position: N/A
| I don't recall which point it was during the weekend coverage of Hurricane Charley that I decided to take a look at insurance stocks. I've been relatively sanguine on insurance companies after reading Martin Weiss' crash-oriented book, Crash Profits: Make Money When Stocks Sink and Soar, which has a number of huge (albeit private) insurance companies essentially underwriting a post-crash American economy. But between the weakness in the broader market and those scenes of trailers smashed like paper lanterns by the 140+ mph winds that swept over Punta Gorda, Florida, I thought it might be worthwhile to check out the charts. |
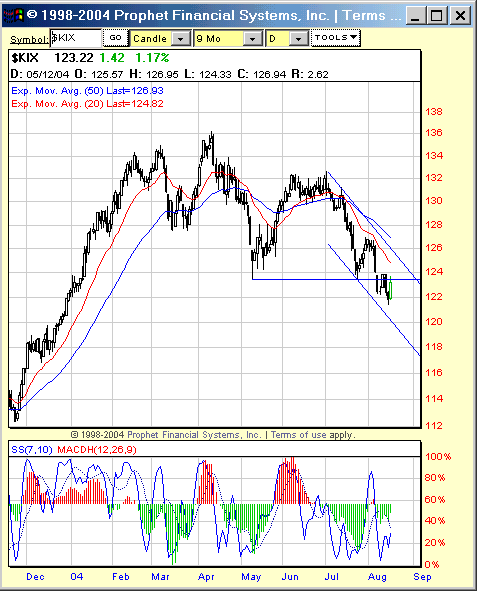
| Looking at the insurance index ($KIX), the dominant technical feature is the topping action that has developed over the course of 2004. Arguably a double top, the $KIX has spent August slipping beneath major support and has actually ticked a new year-to-date low during this correction process. Because of this, I wanted to look to see if any of the individual components of the $KIX was also breaking down, particularly if they too looked as if their year-to-date lows might be a near-term target. |

|
| Major support in the insurance index is broken as the correction that began in July continues into August. |
| Graphic provided by: Prophet Financial Systems, Inc. |
| |
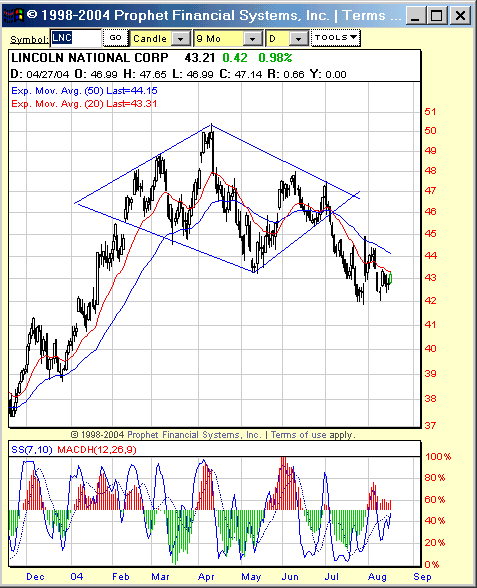
| There were other insurance stocks in worse technical shape. But the clarity of the diamond top in shares of Lincoln National Corporation -- combined with the likelihood that the stock had further to fall -- drew my attention. Notice how the bull market coming out of 2003 helped launch LNC from under 40 at the end of the year to over 50 by April 2004. |
 Figure 2: With a formation size of some seven points and a breakdown at 45, shares of Lincoln National could see new year-to-date lows in the coming months. However, by the time the market made that post-$50 top, prices had already traced out the first half of a diamond top formation. Diamond tops are reversal patterns that can occur at the end of extended rallies in pretty much all time frames. In shape, this price action is bounded by two sets of parallel trendlines and a breakout from the pattern occurs when prices break free of either of the upward or downward trendline boundaries on the right side. Diamonds are prone to false breakouts, so it is often wise to wait for a reaction against the initial breakout before pursuing the reversal. |
| In the present case, LNC has formed a diamond top of approximately seven points in size. It appears as if prices have also broken out from this diamond -- at about the 45 level. Thus, given the size of the pattern, an initial move down should take shares of Lincoln National down to the 38 level. A correction of this extent would mean new yearly lows for LNC. |
Technical Writer for Technical Analysis of STOCKS & COMMODITIES magazine, Working-Money.com, and Traders.com Advantage.
| Title: | Technical Writer |
| Company: | Technical Analysis, Inc. |
| Address: | 4757 California Avenue SW |
| Seattle, WA 98116 | |
| Phone # for sales: | 206 938 0570 |
| Fax: | 206 938 1307 |
| Website: | www.Traders.com |
| E-mail address: | DPenn@traders.com |
Traders' Resource Links | |
| Charting the Stock Market: The Wyckoff Method -- Books | |
| Working-Money.com -- Online Trading Services | |
| Traders.com Advantage -- Online Trading Services | |
| Technical Analysis of Stocks & Commodities -- Publications and Newsletters | |
| Working Money, at Working-Money.com -- Publications and Newsletters | |
| Traders.com Advantage -- Publications and Newsletters | |
| Professional Traders Starter Kit -- Software | |
Click here for more information about our publications!
PRINT THIS ARTICLE

Request Information From Our Sponsors
- VectorVest, Inc.
- Executive Premier Workshop
- One-Day Options Course
- OptionsPro
- Retirement Income Workshop
- Sure-Fire Trading Systems (VectorVest, Inc.)
- Trading as a Business Workshop
- VectorVest 7 EOD
- VectorVest 7 RealTime/IntraDay
- VectorVest AutoTester
- VectorVest Educational Services
- VectorVest OnLine
- VectorVest Options Analyzer
- VectorVest ProGraphics v6.0
- VectorVest ProTrader 7
- VectorVest RealTime Derby Tool
- VectorVest Simulator
- VectorVest Variator
- VectorVest Watchdog
- StockCharts.com, Inc.
- Candle Patterns
- Candlestick Charting Explained
- Intermarket Technical Analysis
- John Murphy on Chart Analysis
- John Murphy's Chart Pattern Recognition
- John Murphy's Market Message
- MurphyExplainsMarketAnalysis-Intermarket Analysis
- MurphyExplainsMarketAnalysis-Visual Analysis
- StockCharts.com
- Technical Analysis of the Financial Markets
- The Visual Investor
