HOT TOPICS LIST
- MACD
- Fibonacci
- RSI
- Gann
- ADXR
- Stochastics
- Volume
- Triangles
- Futures
- Cycles
- Volatility
- ZIGZAG
- MESA
- Retracement
- Aroon
INDICATORS LIST
LIST OF TOPICS
PRINT THIS ARTICLE
by Kevin Hopson
Rowan recently breached key support around the $23.00 level but the long-term technicals still point to higher prices.
Position: Accumulate
Kevin Hopson
Kevin has been a technical analyst for roughly 10 years now. Previously, Kevin owned his own business and acted as a registered investment advisor, specializing in energy. He was also a freelance oil analyst for Orient Trading Co., a commodity futures trading firm in Japan. Kevin is currently a freelance writer.
PRINT THIS ARTICLE
TECHNICAL ANALYSIS
Why Rowan's Breakdown Could Create The Ultimate Buying Opportunity
08/16/04 10:56:46 AMby Kevin Hopson
Rowan recently breached key support around the $23.00 level but the long-term technicals still point to higher prices.
Position: Accumulate
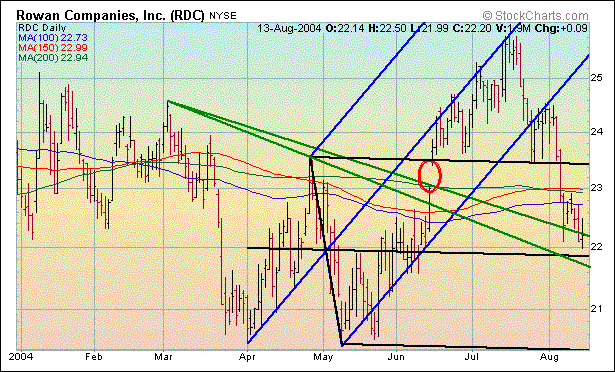
| I touched on Rowan Cos. (RDC) just a couple of weeks ago. At that time, I recommended accumulating shares of the stock, as overly pessimistic market sentiment and a significant confluence of support around the $23.00 level had created a favorable risk/reward scenario. Even though the stock proceeded to breach support in the $22.70 to $23.00 range, the site of its long-term moving averages and June's previously unfilled gap (red circle), the technicals still point to much higher prices down the road. |
| However, before I analyze the long-term picture, notice in the year-to-date chart that Rowan appears to have broken to the downside from a head and shoulders pattern. The top parallel line of the black pitchfork effectively acted as the neckline (support level) for this formation. When Rowan broke this neckline a couple of weeks ago, it signaled further weakness in the stock. To calculate a potential downside target, I took the distance from the completion point of the left shoulder ($23.60) to the peak of the formation ($25.80), and came up with $2.20. Subtracting this from the neckline or point of breakdown, gives a potential downside target of $21.20 ($23.40 - $2.20). |

|
| Figure 1: Daily chart of Rowan. |
| Graphic provided by: Stockcharts.com. |
| |
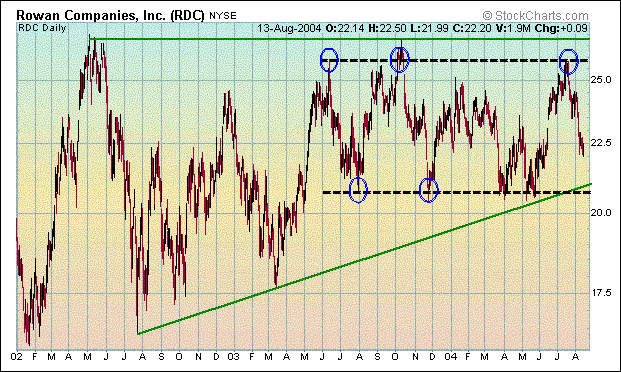
| This price target assumes that short-term support levels, such as the bottom green downtrend line and the black median line, at $21.70 and $21.90 respectively, will fail to hold in the near-term. Regardless of whether $21.70, $21.90, or the $21 level acts as ultimate support, I would not hesitate to accumulate shares in the near-term because the long-term chart shows two bullish patterns forming, both of which indicate significantly higher prices. The first is an ascending triangle Rowan formed over the last two years, as illustrated by the green trendlines. This is a pattern of horizontal (flat) highs and higher lows, which usually leads to an upside breakout. If this occurs, Rowan could eventually make its way up to the $37.00 level. I calculated this price target by taking the base of the triangle (high point minus low point) and adding this figure ($26.75 - $16.50 = $10.25) to the top line ($26.75 + $10.25 = $37.00). |
 Figure 2: Long-term chart of Rowan. Additionally, notice how Rowan has formed a potentially bullish trading range since June of last year. The stock has been stuck between the $21.00 and $26.00 levels for over a year now. Since trading ranges tend to be continuation patterns, this formation supports the ascending triangle theory that higher prices will prevail. For now, the trading range formation indicates a possible upside target between $36.00 and $41.00. I calculated this price target by taking the number of times that prices have tested the upper channel line in alternate sequence, multiplying this number (3) by the width of the trading range ($26.00 - $21.00 = $5.00) and then adding this figure ($5.00 * 3 = $15.00) to the bottom ($21.00 + $15.00 = $36.00) and top ($26.00 + $15.00 = $41.00) channel lines. Since the ascending triangle formation indicates a potential price target of $37.00, $36.00 to $37.00 seems to be a reasonable minimum upside target for the stock. |
| Of course, this is all based on the assumption that prices will eventually break out. Though you should never make assumptions when it comes to investing, trading ranges have been one of the most successful patterns I have ever utilized in technical analysis. Therefore, I have great confidence in this formation. Since the July '02 uptrend line (green uptrend line), the bottom of the current trading range and the price target from the head and shoulders breakdown all indicate a possible reversal around the $21.00 level, I would look for significant support here. Since the upside potential is substantial and market sentiment remains overly pessimistic (please refer to my prior article on Rowan), I would continue to accumulate shares of Rowan in the near-term. |
Kevin has been a technical analyst for roughly 10 years now. Previously, Kevin owned his own business and acted as a registered investment advisor, specializing in energy. He was also a freelance oil analyst for Orient Trading Co., a commodity futures trading firm in Japan. Kevin is currently a freelance writer.
| Glen Allen, VA | |
| E-mail address: | hopson_1@yahoo.com |
Click here for more information about our publications!
Comments
Date: 08/17/04Rank: 3Comment:

|

Request Information From Our Sponsors
- StockCharts.com, Inc.
- Candle Patterns
- Candlestick Charting Explained
- Intermarket Technical Analysis
- John Murphy on Chart Analysis
- John Murphy's Chart Pattern Recognition
- John Murphy's Market Message
- MurphyExplainsMarketAnalysis-Intermarket Analysis
- MurphyExplainsMarketAnalysis-Visual Analysis
- StockCharts.com
- Technical Analysis of the Financial Markets
- The Visual Investor
- VectorVest, Inc.
- Executive Premier Workshop
- One-Day Options Course
- OptionsPro
- Retirement Income Workshop
- Sure-Fire Trading Systems (VectorVest, Inc.)
- Trading as a Business Workshop
- VectorVest 7 EOD
- VectorVest 7 RealTime/IntraDay
- VectorVest AutoTester
- VectorVest Educational Services
- VectorVest OnLine
- VectorVest Options Analyzer
- VectorVest ProGraphics v6.0
- VectorVest ProTrader 7
- VectorVest RealTime Derby Tool
- VectorVest Simulator
- VectorVest Variator
- VectorVest Watchdog
