HOT TOPICS LIST
- MACD
- Fibonacci
- RSI
- Gann
- ADXR
- Stochastics
- Volume
- Triangles
- Futures
- Cycles
- Volatility
- ZIGZAG
- MESA
- Retracement
- Aroon
INDICATORS LIST
LIST OF TOPICS
PRINT THIS ARTICLE
by Ashwani Gujral
Gold seems to be in a $60 range for the foreseeable future, with both the daily and weekly charts showing weak trends. As long as there are the opposite pulls and pushes from interest rate hikes and global terror, gold is likely to remain sideways.
Position: N/A
Ashwani Gujral
He is founder of AGIP Securities Pvt. Ltd. which offers money management services, live chat rooms (during market hours) and independent technical analysis consultancy. The company has a big media presence from the likes of CNBC, NDTV Profit, and ZEE Business.
PRINT THIS ARTICLE
CONSOLID FORMATION
Gold Likely To Remain Sideways
08/13/04 01:54:21 PMby Ashwani Gujral
Gold seems to be in a $60 range for the foreseeable future, with both the daily and weekly charts showing weak trends. As long as there are the opposite pulls and pushes from interest rate hikes and global terror, gold is likely to remain sideways.
Position: N/A
| Markets consolidate 80% of the time. Often technical literature discusses how to trade strong trends. But there are no strong trends most of the time. In this article, I give an example of how to trade a weak trend. Gold has seen sharp appreciation over the last couple of years and now has been consolidating for the last 10 months. This happens as news flows become contrary. On the one hand, there are terror alerts which weaken financial markets. On the other hand, there are impending interest rate hikes that attract capital to U.S. financial assets. As the bulls and bears balance at a certain price level, there is sideways movement that is likely to continue for a long time. Finally, there will be a breakdown or breakout from the consolidation pattern as one side, either the bulls or bears, wins. Consolidations and weak trends are best traded using credit spreads and selling straddles. |

|
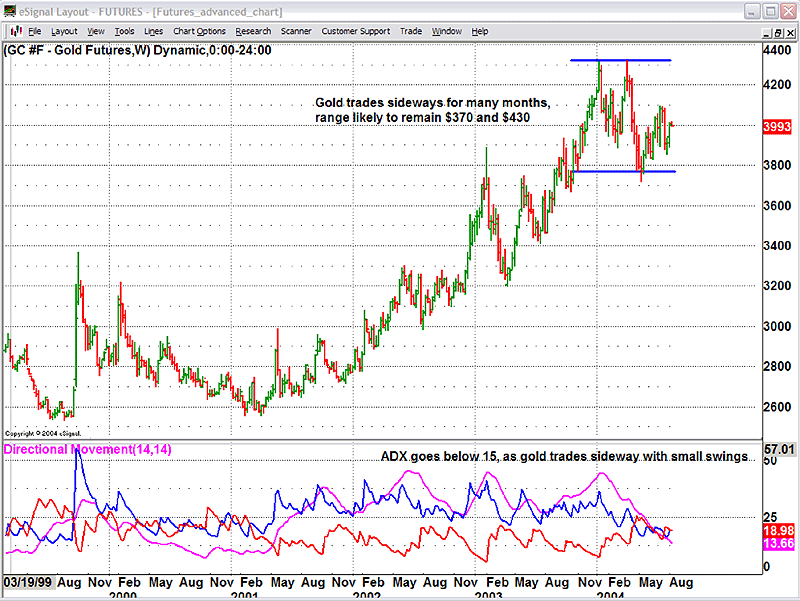
| Figure 1: Weekly chart of gold futures. |
| |
| On the weekly chart, gold has been trading between a range of $370 and $430. Such periods of long consolidations often happen after large moves in either direction. If there is a breakout or breakdown in either direction, we should see a target of $490 on the upside and $310 on the downside. The targets are calculated by adding the range (height) of the sideways pattern to the upper or lower boundary. The ADX has fallen below 15, which indicates sideways movement with small swings. Going by the weekly trends, a breakout does not seem imminent. |
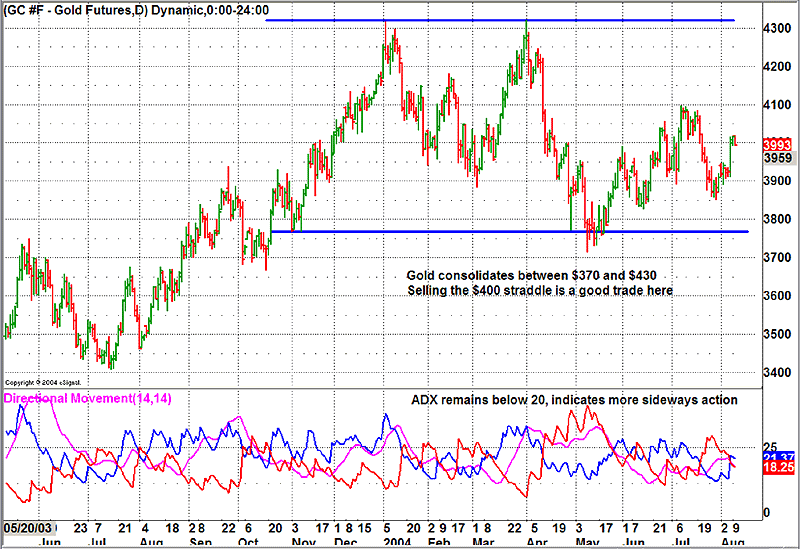
 Figure 2: Daily chart of gold futures. On the daily chart, there has been a similar rangebound movement for months. Such movement does not facilitate directional trades. Therefore selling options is the best way to trade in these trendless, directionless markets. Even the daily ADX is below 20, which does not indicate trending action. A straddle can be sold at the $400 strike, and a substantial time premium can be gained. When gold starts breaking out, it can be hedged by buying out of money calls or puts. |
| Traders should learn to trade sideways, non-trending markets. Taking directional trades in non-directional markets can be lethal. Option selling does provide the opportunity to deal with such price action. |
He is founder of AGIP Securities Pvt. Ltd. which offers money management services, live chat rooms (during market hours) and independent technical analysis consultancy. The company has a big media presence from the likes of CNBC, NDTV Profit, and ZEE Business.
| Title: | Chief mkt strategist |
| Company: | AGIP Securities |
| India | |
| Phone # for sales: | 9871066337 |
| Website: | www.ashwanigujral.com |
| E-mail address: | contact@ashwanigujral.com |
Traders' Resource Links | |
| AGIP Securities has not added any product or service information to TRADERS' RESOURCE. | |
Click here for more information about our publications!
Comments
Date: 08/17/04Rank: 4Comment:

|

Request Information From Our Sponsors
- StockCharts.com, Inc.
- Candle Patterns
- Candlestick Charting Explained
- Intermarket Technical Analysis
- John Murphy on Chart Analysis
- John Murphy's Chart Pattern Recognition
- John Murphy's Market Message
- MurphyExplainsMarketAnalysis-Intermarket Analysis
- MurphyExplainsMarketAnalysis-Visual Analysis
- StockCharts.com
- Technical Analysis of the Financial Markets
- The Visual Investor
- VectorVest, Inc.
- Executive Premier Workshop
- One-Day Options Course
- OptionsPro
- Retirement Income Workshop
- Sure-Fire Trading Systems (VectorVest, Inc.)
- Trading as a Business Workshop
- VectorVest 7 EOD
- VectorVest 7 RealTime/IntraDay
- VectorVest AutoTester
- VectorVest Educational Services
- VectorVest OnLine
- VectorVest Options Analyzer
- VectorVest ProGraphics v6.0
- VectorVest ProTrader 7
- VectorVest RealTime Derby Tool
- VectorVest Simulator
- VectorVest Variator
- VectorVest Watchdog
