HOT TOPICS LIST
- MACD
- Fibonacci
- RSI
- Gann
- ADXR
- Stochastics
- Volume
- Triangles
- Futures
- Cycles
- Volatility
- ZIGZAG
- MESA
- Retracement
- Aroon
INDICATORS LIST
LIST OF TOPICS
PRINT THIS ARTICLE
by David Penn
How much longer will long rates trend lower?
Position: N/A
David Penn
Technical Writer for Technical Analysis of STOCKS & COMMODITIES magazine, Working-Money.com, and Traders.com Advantage.
PRINT THIS ARTICLE
THE DIAMOND
Treasury Diamonds Are Forever
08/13/04 11:10:01 AMby David Penn
How much longer will long rates trend lower?
Position: N/A
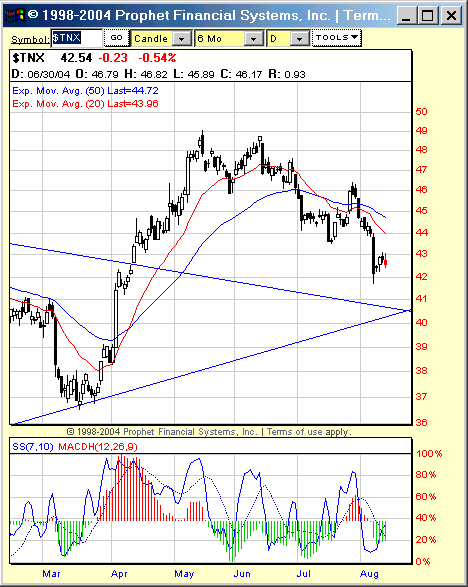
| One month ago I suggested that longer-term interest rates were likely headed lower -- on a short-term basis ("The Ten-year Treasury Yield's Diamond Bottom," Traders.com Advantage, July 12, 2004) -- but would probably turn higher shortly thereafter. Today, I look at the $TNX -- an index of the 10-year Treasury note yield -- and note that what was at 44.43 (roughly 4.44% yield on the T-note) back in mid-July is now 42.54 (roughly 4.25%), approximately a 19 basis point move to the downside in one month. |
| There has been relatively little attention paid to declining long rates -- and the accompanying mini-bull/bear market rally in bonds. This is probably because at the same time that long rates were peaking, stock prices had begun to move down in earnest and the economic focus since June has been on the correction in stocks rather than the move up in T-notes. |

|
| Figure 1: Peaking in May, 10-year T-note rates tumble toward potential support near 4.1%. |
| Graphic provided by: Prophet Financial Systems, Inc.. |
| |
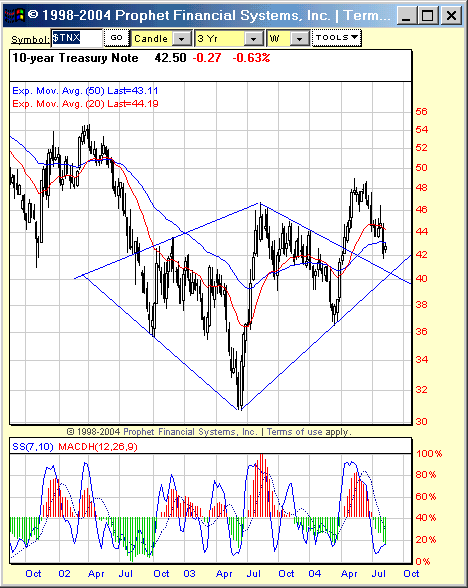
| My initial anticipation of the correction in long rates came courtesy of the diamond bottom pattern I described a month ago in the above-mentioned article. Essentially, this correction is serving the purpose of a pullback from $TNX's breakout from this diamond bottom -- a diamond bottom that has its origins in the summer of 2002. |
| If the analysis of the diamond bottom is accurate, then $TNX should begin to find support at or near these levels. This support could come from the breakout point itself at about 42 (or 4.2%), or perhaps along the downwardly sloping trendline that forms the upper right hand side of the diamond pattern. Even below these levels, a major lower low in the $TNX would not occur until it took out the Q1 2004 low at about 37 (or 3.7%). And until that lower low is taken out, the prognosis for the $TNX remains bullish. |
 Figure 2: Two years in the making, this diamond bottom in $TNX suggests a powerful surge in long-term interest rates in the months to come. The upside projection of the diamond bottom, by the way, remains unchanged by recent price action since the breakout. An initial upside of 57 (or 5.7%) is expected once (or "if") the $TNX resumes its uptrend. This upside is derived by adding the size of the diamond (15) to the value at the point at which prices broke out (42). |
Technical Writer for Technical Analysis of STOCKS & COMMODITIES magazine, Working-Money.com, and Traders.com Advantage.
| Title: | Technical Writer |
| Company: | Technical Analysis, Inc. |
| Address: | 4757 California Avenue SW |
| Seattle, WA 98116 | |
| Phone # for sales: | 206 938 0570 |
| Fax: | 206 938 1307 |
| Website: | www.Traders.com |
| E-mail address: | DPenn@traders.com |
Traders' Resource Links | |
| Charting the Stock Market: The Wyckoff Method -- Books | |
| Working-Money.com -- Online Trading Services | |
| Traders.com Advantage -- Online Trading Services | |
| Technical Analysis of Stocks & Commodities -- Publications and Newsletters | |
| Working Money, at Working-Money.com -- Publications and Newsletters | |
| Traders.com Advantage -- Publications and Newsletters | |
| Professional Traders Starter Kit -- Software | |
Click here for more information about our publications!
PRINT THIS ARTICLE

Request Information From Our Sponsors
- StockCharts.com, Inc.
- Candle Patterns
- Candlestick Charting Explained
- Intermarket Technical Analysis
- John Murphy on Chart Analysis
- John Murphy's Chart Pattern Recognition
- John Murphy's Market Message
- MurphyExplainsMarketAnalysis-Intermarket Analysis
- MurphyExplainsMarketAnalysis-Visual Analysis
- StockCharts.com
- Technical Analysis of the Financial Markets
- The Visual Investor
- VectorVest, Inc.
- Executive Premier Workshop
- One-Day Options Course
- OptionsPro
- Retirement Income Workshop
- Sure-Fire Trading Systems (VectorVest, Inc.)
- Trading as a Business Workshop
- VectorVest 7 EOD
- VectorVest 7 RealTime/IntraDay
- VectorVest AutoTester
- VectorVest Educational Services
- VectorVest OnLine
- VectorVest Options Analyzer
- VectorVest ProGraphics v6.0
- VectorVest ProTrader 7
- VectorVest RealTime Derby Tool
- VectorVest Simulator
- VectorVest Variator
- VectorVest Watchdog
