

HOT TOPICS LIST
- MACD
- Fibonacci
- RSI
- Gann
- ADXR
- Stochastics
- Volume
- Triangles
- Futures
- Cycles
- Volatility
- ZIGZAG
- MESA
- Retracement
- Aroon
INDICATORS LIST
LIST OF TOPICS
PRINT THIS ARTICLE
by Koos van der Merwe
It is often said that General Motors (GM) is the Dow, and where GM goes, the Dow is sure to follow.
Position: N/A
Koos van der Merwe
Has been a technical analyst since 1969, and has worked as a futures and options trader with First Financial Futures in Johannesburg, South Africa.
PRINT THIS ARTICLE
THE FALLING WEDGE
General Motors: A Leading Indicator?
08/16/04 09:29:49 AMby Koos van der Merwe
It is often said that General Motors (GM) is the Dow, and where GM goes, the Dow is sure to follow.
Position: N/A
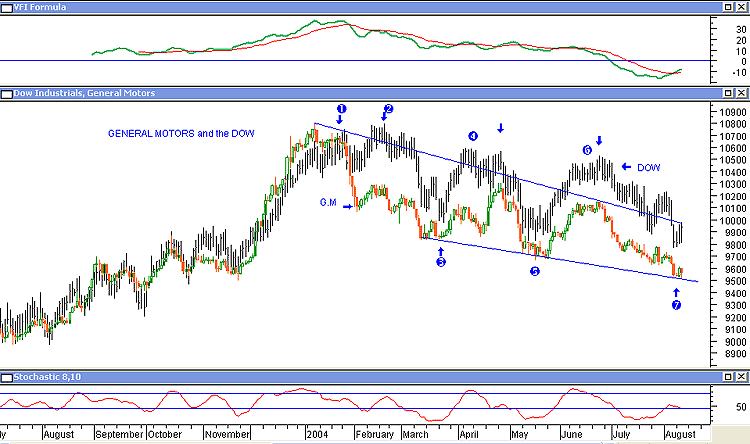
| With the Dow collapsing around us, I decided to find out whether GM truly calls the market. So I plotted the Dow as a black bar chart and superimposed GM in a colored candlestick format over it. When I looked at the results, I was pleasantly surprised. With the numbers on the chart corresponding to the explanations given below, note the following. |
| 1. GM started moving down while the Dow, after a correction, moved higher before following GM's downtrend. 2. The Dow made a new high and GM did not, and from that point the Dow followed GM down. 3. GM started moving up, while the Dow continued down. It almost looks as if GM gave a divergent buy signal. 4. However, the Dow started falling ahead of GM, following the stochastic more than the price of GM. 5. Once again the Dow started moving up in line with a stochastic "buy" signal, rather than a trend change by GM, which continued to fall. GM however soon reversed direction, and followed the Dow up. 6. The Dow gave new highs, while GM made a double top and suggested a down move. Both the Dow and GM fell in tandem. |
|
| The Dow and General Motors. |
| Graphic provided by: MetaStock. |
| |
| What For The Future? 7. GM has found support on its trendline. This support, along with a rising stochastic, is suggesting that GM and hence the Dow, could start moving up to test the upper trendline. Note that the pattern looks like a very large falling wedge -- a bullish signal. This is confirmed by the rising stochastic. A buy signal however, will only be given when the price of GM breaks decisively above the upper resistance line. |
| The VFI (Volume Flow Indicator) introduced by Markos Katsanos in the June 2004 issue of TASC, is also suggesting a change in trend, which will be confirmed when it breaks above the zero line. So here, in all the depressing news we've been seeing lately, is a small sign of hope, a possible rise in the market allowing a selling opportunity into strength. |
| To conclude, I feel that GM can very definitely be used to forecast the Dow's movement. |
Has been a technical analyst since 1969, and has worked as a futures and options trader with First Financial Futures in Johannesburg, South Africa.
| Address: | 3256 West 24th Ave |
| Vancouver, BC | |
| Phone # for sales: | 6042634214 |
| E-mail address: | petroosp@gmail.com |
Click here for more information about our publications!
Comments
Date:�08/16/04Rank:�5Comment:�

Request Information From Our Sponsors
- StockCharts.com, Inc.
- Candle Patterns
- Candlestick Charting Explained
- Intermarket Technical Analysis
- John Murphy on Chart Analysis
- John Murphy's Chart Pattern Recognition
- John Murphy's Market Message
- MurphyExplainsMarketAnalysis-Intermarket Analysis
- MurphyExplainsMarketAnalysis-Visual Analysis
- StockCharts.com
- Technical Analysis of the Financial Markets
- The Visual Investor
- VectorVest, Inc.
- Executive Premier Workshop
- One-Day Options Course
- OptionsPro
- Retirement Income Workshop
- Sure-Fire Trading Systems (VectorVest, Inc.)
- Trading as a Business Workshop
- VectorVest 7 EOD
- VectorVest 7 RealTime/IntraDay
- VectorVest AutoTester
- VectorVest Educational Services
- VectorVest OnLine
- VectorVest Options Analyzer
- VectorVest ProGraphics v6.0
- VectorVest ProTrader 7
- VectorVest RealTime Derby Tool
- VectorVest Simulator
- VectorVest Variator
- VectorVest Watchdog