

HOT TOPICS LIST
- MACD
- Fibonacci
- RSI
- Gann
- ADXR
- Stochastics
- Volume
- Triangles
- Futures
- Cycles
- Volatility
- ZIGZAG
- MESA
- Retracement
- Aroon
INDICATORS LIST
LIST OF TOPICS
PRINT THIS ARTICLE
by Ashwani Gujral
The Nasdaq composite broke down from a bearish head and shoulders pattern on both the daily and weekly pattern. It has returned from the upper end of its weekly range to continue trading in a consolidation range.
Position: N/A
Ashwani Gujral
He is founder of AGIP Securities Pvt. Ltd. which offers money management services, live chat rooms (during market hours) and independent technical analysis consultancy. The company has a big media presence from the likes of CNBC, NDTV Profit, and ZEE Business.
PRINT THIS ARTICLE
HEAD & SHOULDERS
Nasdaq Composite Breaks Down From A Bearish Pattern
08/12/04 04:12:24 PMby Ashwani Gujral
The Nasdaq composite broke down from a bearish head and shoulders pattern on both the daily and weekly pattern. It has returned from the upper end of its weekly range to continue trading in a consolidation range.
Position: N/A
| The head and shoulders pattern signifies accumulation or distribution of a stock/index. The accumulation phase occurs after a market decline. Initially the stock/index makes a bottom, rallies, makes a second bottom, rallies, then makes a third bottom that is higher than the second bottom, and then rallies sharply above the neckline. Conversely, in the distribution phase, the market makes a top, then declines, makes a second higher top, declines, and then a third lower top is followed by a sharp decline, breaking through the neckline. The two cases described above are ideal, textbook patterns. If traders recognize the distributive/accumulative nature of the pattern they can recognize a less-than-perfect head and shoulders configuration, and should be able to confirm it with other indicators. In this article, I will discuss a bearish head and shoulder pattern that had several shoulders and one head, and does not look anything like a normal head and shoulders, but had the same implications. |
|
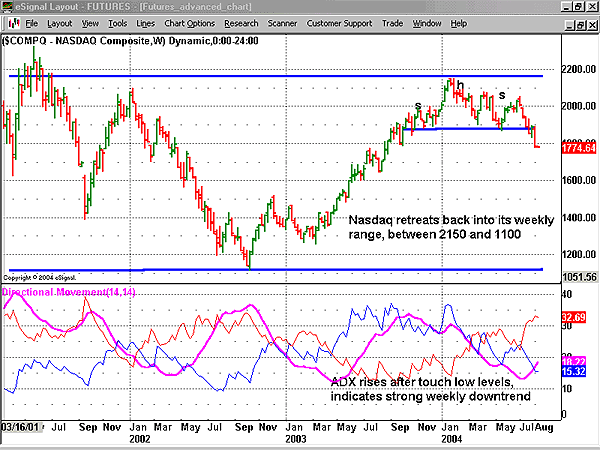
| Figure 1: Weely chart of the Nasdaq. |
| Graphic provided by: eSignal. |
| |
| On the weekly chart, the Nasdaq composite has broken down from a bearish head and shoulders pattern, which brings it back in the long-term range 1100 and 2150. Also the ADX is rising from levels of about 15, which indicates a weekly downtrend. Head and shoulders, or for that matter any pattern, should be confirmed by other indicators. Patterns accompanied by a strong ADX are likely to realize their potential targets. |
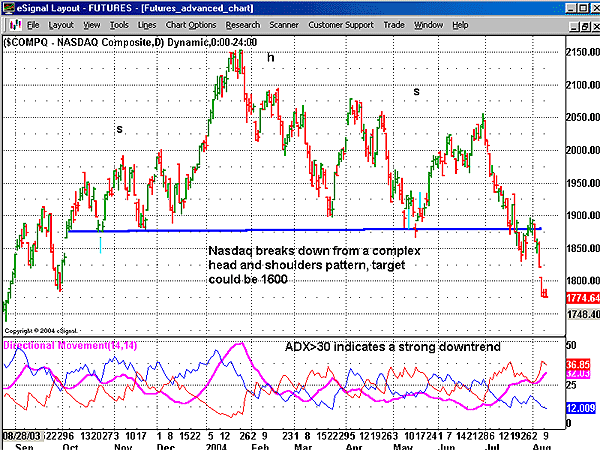 Figure 2: Daily chart of the Nasdaq. On the daily chart, a complex head and shoulders pattern is forming. This head and shoulders pattern has several shoulders, and is also not symmetrical but is proving to be as effective. The important thing is the distributive nature of the pattern, that the market is unable to cross its highs, making lower highs and finally breaking down below 1880. The target of 1600 is calculated by taking the difference of 1880 and 2150 and deducting it from 1880, which is the level of the neckline. The daily ADX is rising above 30, which indicates presence of a strong downtrend and hence the Nasdaq should be sold at all rallies. |
| I've pointed out the conditions that are an ideal foil for a successful head and shoulders pattern. Basically, any pattern needs to be supported by a strong trend in the direction of the breakout or breakdown in order to achieve its target. In sideways markets, most patterns fail to achieve their logical targets. |
He is founder of AGIP Securities Pvt. Ltd. which offers money management services, live chat rooms (during market hours) and independent technical analysis consultancy. The company has a big media presence from the likes of CNBC, NDTV Profit, and ZEE Business.
| Title: | Chief mkt strategist |
| Company: | AGIP Securities |
| India | |
| Phone # for sales: | 9871066337 |
| Website: | www.ashwanigujral.com |
| E-mail address: | contact@ashwanigujral.com |
Traders' Resource Links | |
| AGIP Securities has not added any product or service information to TRADERS' RESOURCE. | |
Click here for more information about our publications!
PRINT THIS ARTICLE

Request Information From Our Sponsors
- StockCharts.com, Inc.
- Candle Patterns
- Candlestick Charting Explained
- Intermarket Technical Analysis
- John Murphy on Chart Analysis
- John Murphy's Chart Pattern Recognition
- John Murphy's Market Message
- MurphyExplainsMarketAnalysis-Intermarket Analysis
- MurphyExplainsMarketAnalysis-Visual Analysis
- StockCharts.com
- Technical Analysis of the Financial Markets
- The Visual Investor
- VectorVest, Inc.
- Executive Premier Workshop
- One-Day Options Course
- OptionsPro
- Retirement Income Workshop
- Sure-Fire Trading Systems (VectorVest, Inc.)
- Trading as a Business Workshop
- VectorVest 7 EOD
- VectorVest 7 RealTime/IntraDay
- VectorVest AutoTester
- VectorVest Educational Services
- VectorVest OnLine
- VectorVest Options Analyzer
- VectorVest ProGraphics v6.0
- VectorVest ProTrader 7
- VectorVest RealTime Derby Tool
- VectorVest Simulator
- VectorVest Variator
- VectorVest Watchdog