HOT TOPICS LIST
- MACD
- Fibonacci
- RSI
- Gann
- ADXR
- Stochastics
- Volume
- Triangles
- Futures
- Cycles
- Volatility
- ZIGZAG
- MESA
- Retracement
- Aroon
INDICATORS LIST
LIST OF TOPICS
PRINT THIS ARTICLE
by Gary Grosschadl
Introgen Therapeutics recently established a 14-month low and is now attempting a reversal.
Position: Buy
Gary Grosschadl
Independent Canadian equities trader and technical analyst based in Peterborough
Ontario, Canada.
PRINT THIS ARTICLE
FIBONACCI
Introgen's (INGN) Reversal Attempt
08/16/04 09:35:25 AMby Gary Grosschadl
Introgen Therapeutics recently established a 14-month low and is now attempting a reversal.
Position: Buy
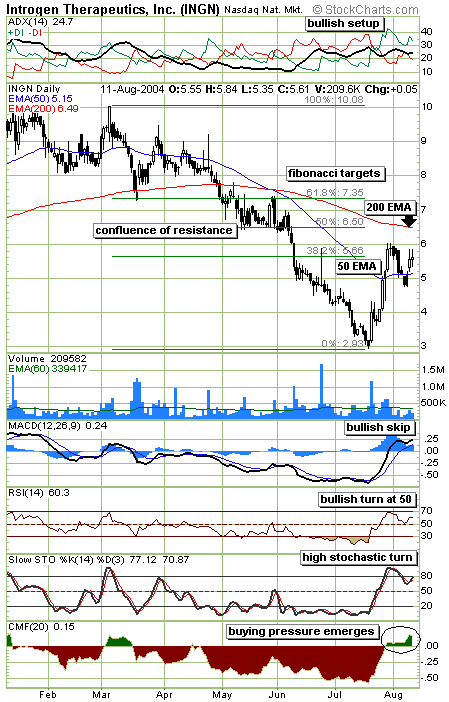
| Over the past year this stock has declined from above $10 to just below $3. The day after it touched $3, a volume spike marked a dramatic upswing that doubled the stock price in the next seven trading days. After such a rise the stock was due for a period of consolidation or retracement. This took the form of a retracement to test support at its 50-day EMA (exponential moving average). |
| After briefly violating this support, the stock popped back above this moving average. Staying above this 50-day EMA is bullish for a renewed attempt at running higher. This has the hallmark of a stock "reloading" for another run. |

|
| INGN's daily chart shows a reversal underway with upside trading targets. |
| Graphic provided by: Stockcharts.com. |
| |
| Fibonacci ratios (derived from an ancient but brilliant Italian mathematician) are used extensively by market technicians in an attempt to anticipate price turning points. These days most charting software allow traders to quickly plot retracement levels based on this Fibonacci principle. When a stock makes an important high or low on a chart (in any time frame), retracement possibilities (to a previous significant mark) can be plotted. Using the low of 2.93 and the high of 10.08 on this chart, the most common retracement levels are plotted. Any Fibonacci trader who targeted a rebound to the first major retracement level of 38.2% or $5.66 was well rewarded as the stock did hit and exceed that target to briefly touch $6, before settling back. Now that the stock is finding some strength above the 50-day EMA, the next Fibonacci level can be considered for a possible higher trading target, that being the 50% retracement mark at $6.50. This is deemed to be a significant trading target because it represents a confluence of resistance. Besides being a Fibonaaci target, this area also represents a previous support area as witnessed on the chart and the ever important 200-day EMA. Under very bullish conditions, a higher trading target could be the next significant Fibonacci target of 61.8% or $7.35. This could take some time to materialize if it occurs at all. |
| Several indicators reflect bullish optimism going forward, making a higher trading target feasible. The directional movement indicator at the top of the chart shows a bullish setup with +DI above -DI and the ADX line being in between. The ideal would be to have the ADX above 25 and upsloping and at 24.7, this could easily develop. The next three indicators all show a "high" bullish turn. This hints at a bullish resumption of the previous run. The final indicator shows a resumption of bullish buying power via the Chaiken money flow indicator or CMF. This acknowledges that buyers have stepped up to the plate and sellers have given up for now. |
| In summary, aggressive short-term traders may want to target the $6.50 region as the next area of significant upside resistance. Should the stock rise above this level and use it as future support, then the 7.35 Fibonacci target could be considered a future trading target. Traders should guard against sudden reversals at or near these trading targets. All bullish bets are off however if the stock weakens to below its 50-day EMA, currently $5.15, by closing below $5. |
Independent Canadian equities trader and technical analyst based in Peterborough
Ontario, Canada.
| Website: | www.whatsonsale.ca/financial.html |
| E-mail address: | gwg7@sympatico.ca |
Click here for more information about our publications!
Comments
Date: 08/17/04Rank: 3Comment:

Request Information From Our Sponsors
- StockCharts.com, Inc.
- Candle Patterns
- Candlestick Charting Explained
- Intermarket Technical Analysis
- John Murphy on Chart Analysis
- John Murphy's Chart Pattern Recognition
- John Murphy's Market Message
- MurphyExplainsMarketAnalysis-Intermarket Analysis
- MurphyExplainsMarketAnalysis-Visual Analysis
- StockCharts.com
- Technical Analysis of the Financial Markets
- The Visual Investor
- VectorVest, Inc.
- Executive Premier Workshop
- One-Day Options Course
- OptionsPro
- Retirement Income Workshop
- Sure-Fire Trading Systems (VectorVest, Inc.)
- Trading as a Business Workshop
- VectorVest 7 EOD
- VectorVest 7 RealTime/IntraDay
- VectorVest AutoTester
- VectorVest Educational Services
- VectorVest OnLine
- VectorVest Options Analyzer
- VectorVest ProGraphics v6.0
- VectorVest ProTrader 7
- VectorVest RealTime Derby Tool
- VectorVest Simulator
- VectorVest Variator
- VectorVest Watchdog
