HOT TOPICS LIST
- MACD
- Fibonacci
- RSI
- Gann
- ADXR
- Stochastics
- Volume
- Triangles
- Futures
- Cycles
- Volatility
- ZIGZAG
- MESA
- Retracement
- Aroon
INDICATORS LIST
LIST OF TOPICS
PRINT THIS ARTICLE
by Arthur Hill
The homebuilders have been leading the market for some time, but signs of distribution are starting to surface in one of the leaders.
Position: N/A
Arthur Hill
Arthur Hill is currently editor of TDTrader.com, a website specializing in trading strategies, sector/industry specific breadth stats and overall technical analysis. He passed the Society of Technical Analysts (STA London) diploma exam with distinction is a Certified Financial Technician (CFTe). Prior to TD Trader, he was the Chief Technical Analyst for Stockcharts.com and the main contributor to the ChartSchool.
PRINT THIS ARTICLE
DOUBLE TOPS
Pulte Plays with Double Top
08/12/04 09:26:37 AMby Arthur Hill
The homebuilders have been leading the market for some time, but signs of distribution are starting to surface in one of the leaders.
Position: N/A
| DR Horton (DHI) was profiled at the end of July with a large head and shoulders reversal in the works. That pattern is still forming, with neckline support just below 25. While DHI is trading well below its March high, Pulte (PHM) moved to within striking distance of its March high and remains one of the stronger stocks in this group and in the market. |

|
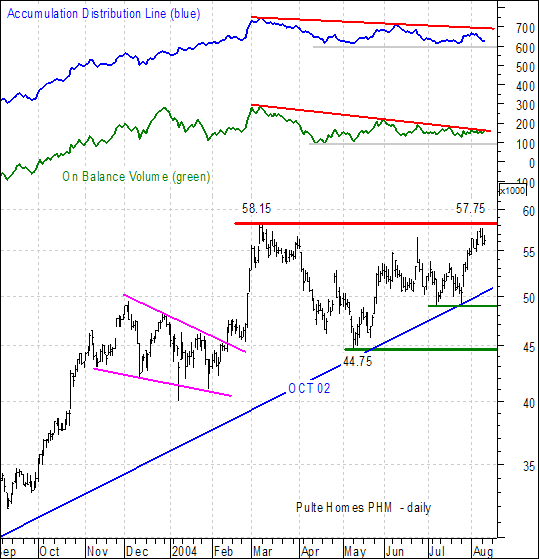
| Figure 1: Pulte Homes daily chart. |
| |
| Price action shows strength, but two key volume indicators suggest more distribution than accumulation. Both the accumulation/distribution line and on-balance volume (OBV) peaked in March and both remain well below their March highs. Even though PHM has yet to exceed its March high (58.15), this amounts to a bearish divergence because the indicators have to confirm strength in the underlying security. Despite this non-confirmation, the indicators have yet to actually break down and have traded flat the last few months. |
| With the indicators flat, the odds of breaking resistance are diminished and this makes a large double top possible. There are two levels to watch for confirmation. The early signal would be a move below 49, which would break the Oct-02 trendline and late July low. Final confirmation would come with a support break at 44.75 and the downside target would be to around 32 (58 - 45 = 13, 45 - 13 = 32). That is quite a move and I would expect some sort of support in the low 40s from the falling wedge at the end of 2003 (magenta trendlines). |
Arthur Hill is currently editor of TDTrader.com, a website specializing in trading strategies, sector/industry specific breadth stats and overall technical analysis. He passed the Society of Technical Analysts (STA London) diploma exam with distinction is a Certified Financial Technician (CFTe). Prior to TD Trader, he was the Chief Technical Analyst for Stockcharts.com and the main contributor to the ChartSchool.
| Title: | Editor |
| Company: | TDTrader.com |
| Address: | Willem Geetsstraat 17 |
| Mechelen, B2800 | |
| Phone # for sales: | 3215345465 |
| Website: | www.tdtrader.com |
| E-mail address: | arthurh@tdtrader.com |
Traders' Resource Links | |
| TDTrader.com has not added any product or service information to TRADERS' RESOURCE. | |
Click here for more information about our publications!
PRINT THIS ARTICLE

Request Information From Our Sponsors
- StockCharts.com, Inc.
- Candle Patterns
- Candlestick Charting Explained
- Intermarket Technical Analysis
- John Murphy on Chart Analysis
- John Murphy's Chart Pattern Recognition
- John Murphy's Market Message
- MurphyExplainsMarketAnalysis-Intermarket Analysis
- MurphyExplainsMarketAnalysis-Visual Analysis
- StockCharts.com
- Technical Analysis of the Financial Markets
- The Visual Investor
- VectorVest, Inc.
- Executive Premier Workshop
- One-Day Options Course
- OptionsPro
- Retirement Income Workshop
- Sure-Fire Trading Systems (VectorVest, Inc.)
- Trading as a Business Workshop
- VectorVest 7 EOD
- VectorVest 7 RealTime/IntraDay
- VectorVest AutoTester
- VectorVest Educational Services
- VectorVest OnLine
- VectorVest Options Analyzer
- VectorVest ProGraphics v6.0
- VectorVest ProTrader 7
- VectorVest RealTime Derby Tool
- VectorVest Simulator
- VectorVest Variator
- VectorVest Watchdog
