

HOT TOPICS LIST
- MACD
- Fibonacci
- RSI
- Gann
- ADXR
- Stochastics
- Volume
- Triangles
- Futures
- Cycles
- Volatility
- ZIGZAG
- MESA
- Retracement
- Aroon
INDICATORS LIST
LIST OF TOPICS
PRINT THIS ARTICLE
by Jason Braswell
NYMEX natural gas is hovering over a confluence of support, both long- and short-term. All signs point to a modest rise very soon, and unless long-term resistance can reign in the rally, it will likely be a precursor to a longer term advance.
Position: Hold
Jason Braswell
Jason Braswell is the Director of Risk Management Services for Infinite Consulting, LLC. He attended graduate school for mathematics at the University of Florida in Gainesville and is an MTA affiliate.
PRINT THIS ARTICLE
SUPPORT & RESISTANCE
NYMEX Gas Making A Decision Soon
08/13/04 10:03:20 AMby Jason Braswell
NYMEX natural gas is hovering over a confluence of support, both long- and short-term. All signs point to a modest rise very soon, and unless long-term resistance can reign in the rally, it will likely be a precursor to a longer term advance.
Position: Hold
| Last time I discussed natural gas, I adduced evidence in favor of gas breaking through the long-term support line, shown in Figure 1, that it was steadily approaching. Unfortunately for my forecast, now that we're upon that long-term support, it appears that gas doesn't have enough momentum to push through, as there are some solid barriers shoring up the downside against prices. |
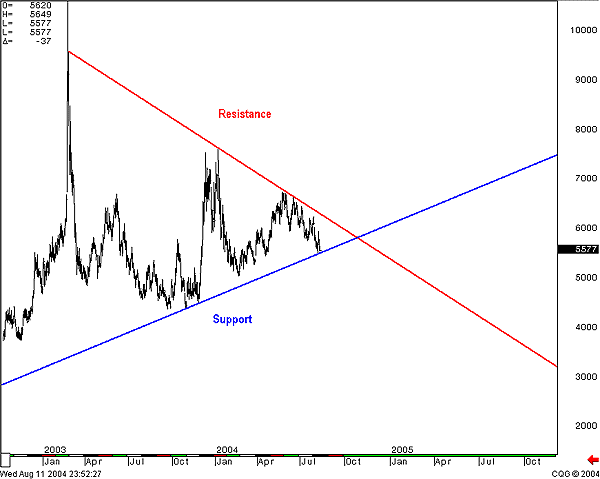
|
| Figure 1: Support and resistance lines forming a symmetrical triangle. |
| Graphic provided by: CQG Net. |
| |
| First, prices have already tested the waters of long-term support at a low of $5.51, and they failed, rallying off sharply; that doesn't seem to bode well for the success of another run in the next few weeks. Second, a falling wedge pattern has developed over the past couple of months, which anticipates an upside breakout soon, sometime between two-thirds and three-fourths of the way down the pattern. Third, a couple of key oscillators are oversold and diverging, including the 14,3,3 stochastic and the accumulation/distribution line. Finally, we're sitting right on top of the bottom Bollinger Band, indicating that prices are ready to at least move back to the 20-period MA and/or the top band. |
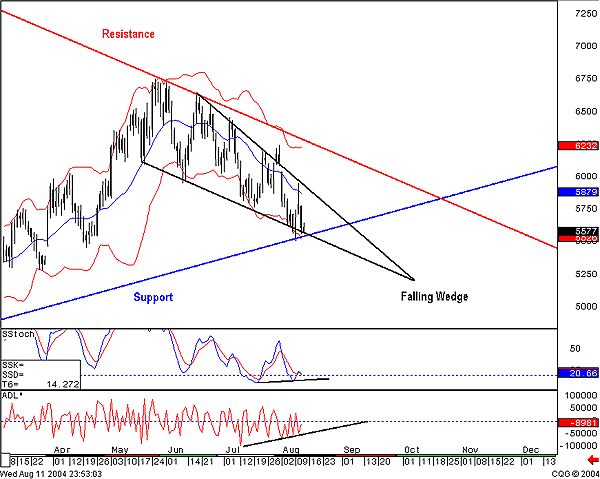 Figure 2: Daily chart of NYMEX. Hence, there are a lot of signals pointing to prices at least moving back up to test our major resistance soon, with the usual measuring implications of a falling wedge projecting even past that point. If, however, resistance can hold, prices may get yet another shot at this 2-year support line. The direction of this price break will determine the long-term trend of natural gas, and this contract will have to make a decision before late October. |
One way to perhaps get a preview of the direction of the front month's break is to watch the March-April spread, shown below. Natural gas sees dependable backwardation between late winter and early spring months due to the injection/withdrawal cycles of those with storage assets. (Sufficient gas must be stored during the summer for use during the heating season.) As you can see on Figure 3, this spread has also materialized into a triangle/wedge that has to break out soon, but the time limit on this pattern is a more prompt early September. If it breaks topside, winter looks to rise much higher, making then the time to buy for the entire winter season.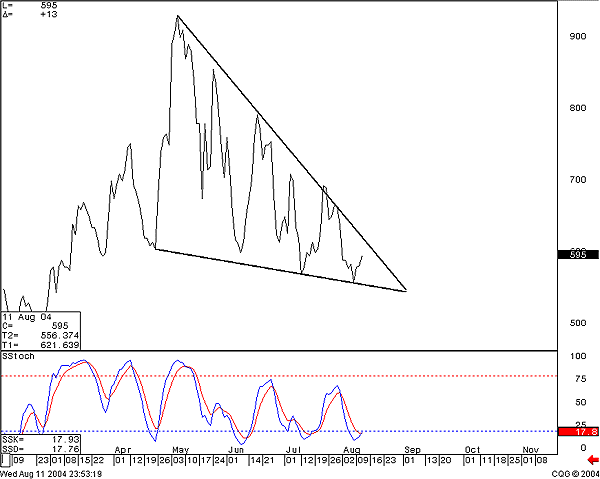 Figure 3: March-April spread of NYMEX. So, for short-term traders, buy up the near months. For those with longer-term interests, hold out until we get a clear signal on either the continuation chart or the spread chart. |
Jason Braswell is the Director of Risk Management Services for Infinite Consulting, LLC. He attended graduate school for mathematics at the University of Florida in Gainesville and is an MTA affiliate.
| Company: | Infinite Consulting, LLC |
| Website: | www.infiniteconsulting.org |
| E-mail address: | jbraswell@infiniteconsulting.org |
Traders' Resource Links | |
| Infinite Consulting, LLC has not added any product or service information to TRADERS' RESOURCE. | |
Click here for more information about our publications!
Comments
Date:�08/17/04Rank:�4Comment:�

Request Information From Our Sponsors
- StockCharts.com, Inc.
- Candle Patterns
- Candlestick Charting Explained
- Intermarket Technical Analysis
- John Murphy on Chart Analysis
- John Murphy's Chart Pattern Recognition
- John Murphy's Market Message
- MurphyExplainsMarketAnalysis-Intermarket Analysis
- MurphyExplainsMarketAnalysis-Visual Analysis
- StockCharts.com
- Technical Analysis of the Financial Markets
- The Visual Investor
- VectorVest, Inc.
- Executive Premier Workshop
- One-Day Options Course
- OptionsPro
- Retirement Income Workshop
- Sure-Fire Trading Systems (VectorVest, Inc.)
- Trading as a Business Workshop
- VectorVest 7 EOD
- VectorVest 7 RealTime/IntraDay
- VectorVest AutoTester
- VectorVest Educational Services
- VectorVest OnLine
- VectorVest Options Analyzer
- VectorVest ProGraphics v6.0
- VectorVest ProTrader 7
- VectorVest RealTime Derby Tool
- VectorVest Simulator
- VectorVest Variator
- VectorVest Watchdog