HOT TOPICS LIST
- MACD
- Fibonacci
- RSI
- Gann
- ADXR
- Stochastics
- Volume
- Triangles
- Futures
- Cycles
- Volatility
- ZIGZAG
- MESA
- Retracement
- Aroon
INDICATORS LIST
LIST OF TOPICS
PRINT THIS ARTICLE
A Closer Look At
08/16/04 09:26:58 AM
by Koos van der Merwe
The above article appeared in the March 2004 issue of "Technical Analysis of STOCKS & COMMODITIES," by Robert R. Prechter and Peter Kendall.
Position: Sell
Koos van der Merwe
Has been a technical analyst since 1969, and has worked as a futures and options trader with First Financial Futures in Johannesburg, South Africa.
PRINT THIS ARTICLE
GANN ANGLE
A Closer Look At
"A Developing Depression. . .Not A Boom"
08/16/04 09:26:58 AMby Koos van der Merwe
The above article appeared in the March 2004 issue of "Technical Analysis of STOCKS & COMMODITIES," by Robert R. Prechter and Peter Kendall.
Position: Sell
| The article ended with, ". . .we conclude that the next economic contraction in the U.S. will be more severe than any of the contractions following period III. In fact, it will be no less relentless or acute than the contraction of the 1930s. . ." |
| In actual fact, the correction should be somewhere in the area of "the fourth wave of lesser degree." (All quotes are from Elliott Wave Principle by Robert Prechter and AJ Frost.) This is the rule, but not necessarily true. However, accepting that it could be true, let's examine the movement of the Dow over the long and short-term. |

|
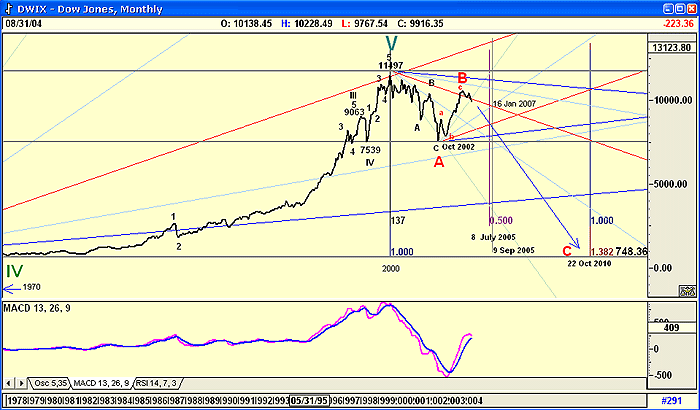
| Figure 1: Monthly chart of the Dow. |
| Graphic provided by: AdvancedGET. |
| |
| I have presented Figure 1 on more than one occasion on Traders.com Advantage. It is a monthly chart of the Dow. In it I am showing the end of WAVE IV and the count for WAVE V, followed by the A, B and expected C WAVE decline. The shocking reality is that if Dow follows classical Wave theory, then it should, or could, fall to a low of 748.36, the low of WAVE IV. Hence the dramatic conclusion quoted above. C Waves "are a devatsting collapse" with "the low point of wave C. . . within the zone of the 4th wave of lesser degree." The fourth wave is the zone 1000 to 748.36. (The high of 1000 is not shown on the chart). |
| Wave theory teaches, "Declining C-Waves are usually devastating in their destruction. Do NOT hold stocks in this phase, only cash." Scary isn't it? But isn't this the state of the world today, with anticipated terrorist attacks calling the shots? Just look at recent events, from armed guards at U.S. Financial institutions the past few weeks; the lack of attendance at the Olympic Games in Greece because of fear of a terrorist attack, and the anticipated disruption of the U.S. Presidential elections. Then of course, there is Iraq; a stratospheric oil price, falling jobs in the U.S., and so it goes on and on. No wonder the investing community is scared, far preferring cash in the mattress to equities at their brokers. As to when WAVE C will end, Wave theory suggests October 2010, which is a 38.2% Fibonocci reading of the rise from 1970 to 1999/2000. Notice too how the MACD indicator is turning over into what could be a major sell signal. |
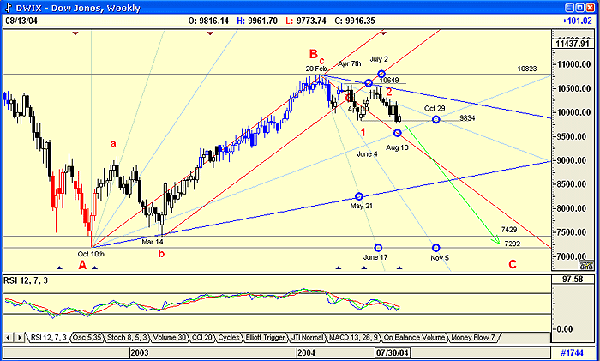
 Figure 2: Weekly chart of the Dow. With the weekly chart I have added Gann fans to major highs and lows in an attempt to determine possible turning points. These occur when the angles either cross the horizontal from the previous start point of the Gann fan, or when they cross each other. I have shown the expected turning points on the chart with a circle. I have also shown the start of a possible wave count of wave C. This count can vary as wave C evolves. At present the chart is suggesting that the Dow has found support at 9834, a support level that coincides with the August 13 turning point. Other anticipated turning points are October 29th and November 5th. I have also shown support levels at 7429 and 7202. These are major levels, and any move through them will be painful, and will support the monthly wave count in all its devastation. I would advise that any correction upwards in the weekly chart should be used as an opportunity to move into cash. Finally, note that any move in the Dow above 10823 negates this entire analysis. Am I scared? You bet I am. Charts are suggesting possible devastation, and at the moment there are no positive signs on the horizon. Be more than careful out there. |
Has been a technical analyst since 1969, and has worked as a futures and options trader with First Financial Futures in Johannesburg, South Africa.
| Address: | 3256 West 24th Ave |
| Vancouver, BC | |
| Phone # for sales: | 6042634214 |
| E-mail address: | petroosp@gmail.com |
Click here for more information about our publications!
Comments
Date: 08/16/04Rank: 5Comment:
Date: 08/17/04Rank: 4Comment:

Request Information From Our Sponsors
- StockCharts.com, Inc.
- Candle Patterns
- Candlestick Charting Explained
- Intermarket Technical Analysis
- John Murphy on Chart Analysis
- John Murphy's Chart Pattern Recognition
- John Murphy's Market Message
- MurphyExplainsMarketAnalysis-Intermarket Analysis
- MurphyExplainsMarketAnalysis-Visual Analysis
- StockCharts.com
- Technical Analysis of the Financial Markets
- The Visual Investor
- VectorVest, Inc.
- Executive Premier Workshop
- One-Day Options Course
- OptionsPro
- Retirement Income Workshop
- Sure-Fire Trading Systems (VectorVest, Inc.)
- Trading as a Business Workshop
- VectorVest 7 EOD
- VectorVest 7 RealTime/IntraDay
- VectorVest AutoTester
- VectorVest Educational Services
- VectorVest OnLine
- VectorVest Options Analyzer
- VectorVest ProGraphics v6.0
- VectorVest ProTrader 7
- VectorVest RealTime Derby Tool
- VectorVest Simulator
- VectorVest Variator
- VectorVest Watchdog
