HOT TOPICS LIST
- MACD
- Fibonacci
- RSI
- Gann
- ADXR
- Stochastics
- Volume
- Triangles
- Futures
- Cycles
- Volatility
- ZIGZAG
- MESA
- Retracement
- Aroon
INDICATORS LIST
LIST OF TOPICS
PRINT THIS ARTICLE
by Gary Grosschadl
Boeing's stock price has held up very well in the midst of recent market pain and high oil prices but this trader sees likely turbulence ahead.
Position: Sell
Gary Grosschadl
Independent Canadian equities trader and technical analyst based in Peterborough
Ontario, Canada.
PRINT THIS ARTICLE
DOUBLE TOPS
Forecasting Boeing Turbulence
08/13/04 09:35:38 AMby Gary Grosschadl
Boeing's stock price has held up very well in the midst of recent market pain and high oil prices but this trader sees likely turbulence ahead.
Position: Sell
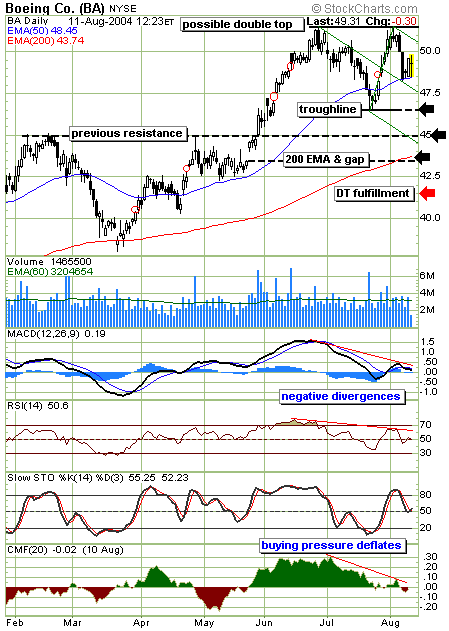
| This daily chart suggests Boeing (BA) may be in the process of a double top. A double top is only confirmed when the troughline is broken to the downside and this has yet to occur. However there is enough potential weakness in several key indicators to suggest that at least a troughline test is likely to occur. |
| Currently BA has found support from its 50-day EMA (exponentential moving average), currently at $48.45. However this may only be temporary. Although I indicate a sell position, this is premature unless the stock closes below this moving average. This is an aggressive, higher risk stance. A more conservative approach would be to wait for the troughline to be violated, showing a double top failure confirmation (if it holds). |

|
| This daily chart suggests a double top in the making. |
| Graphic provided by: Stockcharts.com. |
| |
| An Andrews pitchfork has been drawn using three significant turning points, those being the two tops and the troughline. This bearish pointing pitchfork (in green) shows a move to the median (center) line and the subsequent bounce attempt. Should the bears take firm control, a more serious decline could eventually test the lower median line, which is close to a previous resistance line as marked. Previous resistance often represents future support so some traders may be looking for some sort of bounce here. Below that level is another likely area of strong support as represented by the ever important 200-day EMA, which also coincides with closing another gap. Stocks that retrace often close previous gaps and this has been the case here as depicted by the five gaps circled in red. If this does turn out to be a classic double top, then the final target (pattern fulfillment) becomes a move down to $41.50 (red arrow). This represents the distance from the double top to the troughline, applied to the downside move below the troughline. I am not suggesting that this will happen, only that it can if very bearish conditions prevail. |
| The indicators below the chart show significant negative divergences that have me taking a bearish outlook going forward (provided that we first see a close below the 50-day EMA). When the second top materialized, the MACD (moving average convergence/divergence), the RSI (relative strength index) and the CMF (Chaiken Money Flow) index, all fell well short of reaching a similar peak. This showed a latent weakness in this market. Whether this merely pointed to the initial decline or a bigger one still to occur, has yet to be seen. In the case of the CMF, the serious erosion of buying pressure is suggestive of a bigger drop coming. |
| The next signs of downside trouble (in order) are: violations of the 50-day EMA, and the pitchfork median line. Until this happens, a move to test the upper median line is not out of the question. Time will tell soon enough. Traders should be alert to potential reversals at any of the previously discussed marks shown by arrows on the chart. Should the stock make a surprise move in the other direction to close above the upper median line, then I am at the wrong airport and the bearish call is grounded. |
Independent Canadian equities trader and technical analyst based in Peterborough
Ontario, Canada.
| Website: | www.whatsonsale.ca/financial.html |
| E-mail address: | gwg7@sympatico.ca |
Click here for more information about our publications!
PRINT THIS ARTICLE

Request Information From Our Sponsors
- StockCharts.com, Inc.
- Candle Patterns
- Candlestick Charting Explained
- Intermarket Technical Analysis
- John Murphy on Chart Analysis
- John Murphy's Chart Pattern Recognition
- John Murphy's Market Message
- MurphyExplainsMarketAnalysis-Intermarket Analysis
- MurphyExplainsMarketAnalysis-Visual Analysis
- StockCharts.com
- Technical Analysis of the Financial Markets
- The Visual Investor
- VectorVest, Inc.
- Executive Premier Workshop
- One-Day Options Course
- OptionsPro
- Retirement Income Workshop
- Sure-Fire Trading Systems (VectorVest, Inc.)
- Trading as a Business Workshop
- VectorVest 7 EOD
- VectorVest 7 RealTime/IntraDay
- VectorVest AutoTester
- VectorVest Educational Services
- VectorVest OnLine
- VectorVest Options Analyzer
- VectorVest ProGraphics v6.0
- VectorVest ProTrader 7
- VectorVest RealTime Derby Tool
- VectorVest Simulator
- VectorVest Variator
- VectorVest Watchdog
