

HOT TOPICS LIST
- MACD
- Fibonacci
- RSI
- Gann
- ADXR
- Stochastics
- Volume
- Triangles
- Futures
- Cycles
- Volatility
- ZIGZAG
- MESA
- Retracement
- Aroon
INDICATORS LIST
LIST OF TOPICS
PRINT THIS ARTICLE
by Gary Grosschadl
The Toronto Stock Index (TSX) has been safely above its 200-day exponential moving average for the past 15 months. Now it's being tested with a recent close below that mark.
Position: Hold
Gary Grosschadl
Independent Canadian equities trader and technical analyst based in Peterborough
Ontario, Canada.
PRINT THIS ARTICLE
CHART ANALYSIS
Toronto (TSX) In Trouble?
08/12/04 10:55:50 AMby Gary Grosschadl
The Toronto Stock Index (TSX) has been safely above its 200-day exponential moving average for the past 15 months. Now it's being tested with a recent close below that mark.
Position: Hold
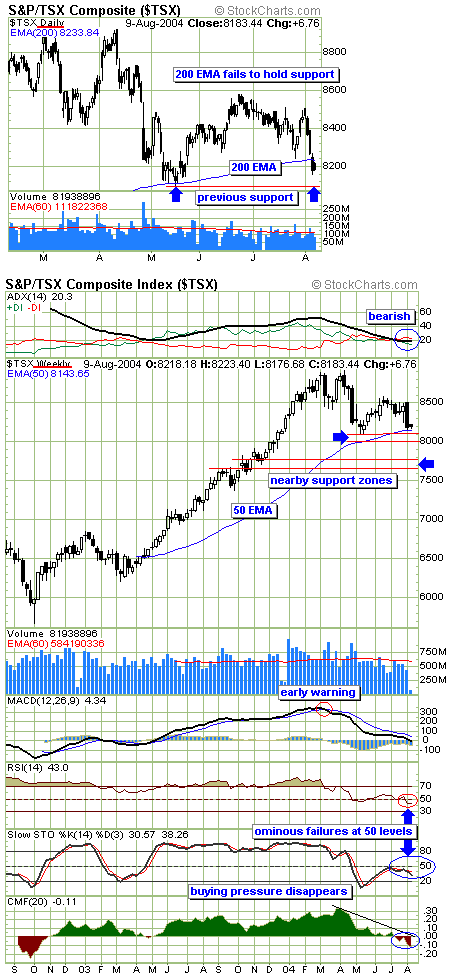
| The downward pressure of the main American indexes of late, looks also to be affecting the main Canadian index. This index has held up better than the U.S. counterparts because it has heavier weighting of natural resources, specifically oil, gas, metals and gold. The position of the ever significant 200-day exponential moving averages shows how the TSX has held up better on the daily charts of these indexes thus far. The tech-laden Nasdaq has been under the 200-day EMA for a month and the Dow has very recently made a 300 point plunge below its 200-day EMA. Meanwhile the TSX has been above that mark for 15 months and just now is testing that barrier with a recent close below the 200-day EMA. |
| The daily chart shows this recent weakness. Despite this dip below the 200-day EMA, there is possible nearby support from a previous test near 8100. So a bounce back up is a possibility. It would be wise to consult a longer term chart, such as the weekly chart to gain more insight. |
|
| The TSX reaches a crucial point on both the daily and weekly charts. |
| Graphic provided by: Stockcharts.com. |
| |
| The weekly chart shows an important support level at the 50-day EMA. A support zone is suggested between this moving average and 8000. Should this fail, the next support zone is likely the area of 7700, this being several hundred points lower. |
| The displayed indicators appear more bearish than the chart, hinting at more downside ahead. The trend strength indicator at the top of the chart shows a bearish setup with the DI's in a negative stance (-DI above +DI) with the ADX component inbetween. A strong trend is often indicated with a ADX value above 25 accompanied by an obvious upslope. This is not quite the case here yet but close enough to make some traders wary. The MACD (moving average convergence/divergence) shows an obvious downtrend since its very timely warning with a bearish crossover. The RSI (relative strength index) and the stochastics both show weakness below their often key 50 levels. The CMF or Chaiken Money Flow indicator paints an interesting picture. Buying pressure dramatically declined after the early highs of 2004. This supply/demand indicator accurately depicted that the smart money was happy to take profits and had no interest in tolerating any decline below the 8500 level. With this indicator now negative, one has to wonder if this is not a harbinger of continued weakness. |
| The action over the next couple of weeks should show traders whether a sustainable bounce will occur or if more downside leads to the lower support test near 7700. |
Independent Canadian equities trader and technical analyst based in Peterborough
Ontario, Canada.
| Website: | www.whatsonsale.ca/financial.html |
| E-mail address: | gwg7@sympatico.ca |
Click here for more information about our publications!
PRINT THIS ARTICLE

Request Information From Our Sponsors
- StockCharts.com, Inc.
- Candle Patterns
- Candlestick Charting Explained
- Intermarket Technical Analysis
- John Murphy on Chart Analysis
- John Murphy's Chart Pattern Recognition
- John Murphy's Market Message
- MurphyExplainsMarketAnalysis-Intermarket Analysis
- MurphyExplainsMarketAnalysis-Visual Analysis
- StockCharts.com
- Technical Analysis of the Financial Markets
- The Visual Investor
- VectorVest, Inc.
- Executive Premier Workshop
- One-Day Options Course
- OptionsPro
- Retirement Income Workshop
- Sure-Fire Trading Systems (VectorVest, Inc.)
- Trading as a Business Workshop
- VectorVest 7 EOD
- VectorVest 7 RealTime/IntraDay
- VectorVest AutoTester
- VectorVest Educational Services
- VectorVest OnLine
- VectorVest Options Analyzer
- VectorVest ProGraphics v6.0
- VectorVest ProTrader 7
- VectorVest RealTime Derby Tool
- VectorVest Simulator
- VectorVest Variator
- VectorVest Watchdog