HOT TOPICS LIST
- MACD
- Fibonacci
- RSI
- Gann
- ADXR
- Stochastics
- Volume
- Triangles
- Futures
- Cycles
- Volatility
- ZIGZAG
- MESA
- Retracement
- Aroon
INDICATORS LIST
LIST OF TOPICS
PRINT THIS ARTICLE
by Kevin Hopson
Despite last week's sharp correction in the equity market, current volatility levels do not indicate a significant bottom in the S&P 100.
Position: N/A
Kevin Hopson
Kevin has been a technical analyst for roughly 10 years now. Previously, Kevin owned his own business and acted as a registered investment advisor, specializing in energy. He was also a freelance oil analyst for Orient Trading Co., a commodity futures trading firm in Japan. Kevin is currently a freelance writer.
PRINT THIS ARTICLE
VOLATILITY
The Volatility Index Continues To Point To Lower Stock Prices
08/10/04 11:15:21 AMby Kevin Hopson
Despite last week's sharp correction in the equity market, current volatility levels do not indicate a significant bottom in the S&P 100.
Position: N/A
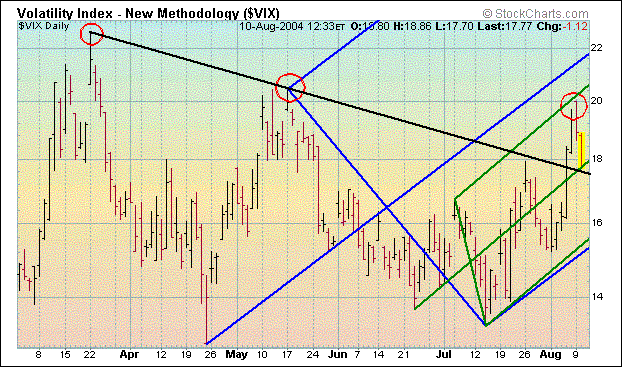
| I touched on the CBOE Volatility Index (VIX) and the S&P 100 Index (OEX) just last week. At that time, I said the VIX was at historically low levels, meaning that market sentiment continued to be overly optimistic despite the year-to-date decline in the S&P 100. As a result, I anticipated a sharp decline in the OEX and related indexes, which happened towards the end of last week. Unfortunately for longs, the VIX is still pointing to lower equity prices despite the corrective rally currently occurring in the market. |
| There are a number of reasons for this theory. Notice how the VIX recently breached March's downtrend line, which had capped prices up until last week. This trendline was a significant resistance level for the index. As a result, the short-term trend has turned positive. Also, the VIX put in a lower high this week despite the fact that the S&P 100 recently hit a new low for 2004. This means there was less fear (more optimism) during the recent OEX pullback than in the May pullback, which is a bearish divergence for the S&P 100. |

|
| Graphic provided by: Stockcharts.com. |
| |
| The VIX is now approaching potential bouncing points and has a plethora of support in the $15.70 to $16.90 range. The VIX is currently testing March's downtrend line (prior resistance tends to act as support), as well as the green median line, which have both converged in the $17.60 to $18.00 range. Even if this area of support fails to hold, all of the index's moving averages (10-, 20-, 50-, 100-, 150- and 200-day) currently reside in the $15.70 to $16.90 range. So, even though the VIX could pull back further in the near-term and the markets could continue to rally off the recent lows, the path of least resistance for the VIX is up. Coupled with the fact that volatility (or fear) remains low, I still anticipate lower equity prices longer-term. |
Kevin has been a technical analyst for roughly 10 years now. Previously, Kevin owned his own business and acted as a registered investment advisor, specializing in energy. He was also a freelance oil analyst for Orient Trading Co., a commodity futures trading firm in Japan. Kevin is currently a freelance writer.
| Glen Allen, VA | |
| E-mail address: | hopson_1@yahoo.com |
Click here for more information about our publications!
PRINT THIS ARTICLE

Request Information From Our Sponsors
- StockCharts.com, Inc.
- Candle Patterns
- Candlestick Charting Explained
- Intermarket Technical Analysis
- John Murphy on Chart Analysis
- John Murphy's Chart Pattern Recognition
- John Murphy's Market Message
- MurphyExplainsMarketAnalysis-Intermarket Analysis
- MurphyExplainsMarketAnalysis-Visual Analysis
- StockCharts.com
- Technical Analysis of the Financial Markets
- The Visual Investor
- VectorVest, Inc.
- Executive Premier Workshop
- One-Day Options Course
- OptionsPro
- Retirement Income Workshop
- Sure-Fire Trading Systems (VectorVest, Inc.)
- Trading as a Business Workshop
- VectorVest 7 EOD
- VectorVest 7 RealTime/IntraDay
- VectorVest AutoTester
- VectorVest Educational Services
- VectorVest OnLine
- VectorVest Options Analyzer
- VectorVest ProGraphics v6.0
- VectorVest ProTrader 7
- VectorVest RealTime Derby Tool
- VectorVest Simulator
- VectorVest Variator
- VectorVest Watchdog
