HOT TOPICS LIST
- MACD
- Fibonacci
- RSI
- Gann
- ADXR
- Stochastics
- Volume
- Triangles
- Futures
- Cycles
- Volatility
- ZIGZAG
- MESA
- Retracement
- Aroon
INDICATORS LIST
LIST OF TOPICS
PRINT THIS ARTICLE
by Koos van der Merwe
BlackBerry - those popular wireless handlends. Anyone who has one is quick to whip it out as a status symbol. What do the charts tell us?
Position: Accumulate
Koos van der Merwe
Has been a technical analyst since 1969, and has worked as a futures and options trader with First Financial Futures in Johannesburg, South Africa.
PRINT THIS ARTICLE
ELLIOTT WAVE
Research In Motion
08/10/04 12:10:05 PMby Koos van der Merwe
BlackBerry - those popular wireless handlends. Anyone who has one is quick to whip it out as a status symbol. What do the charts tell us?
Position: Accumulate

|
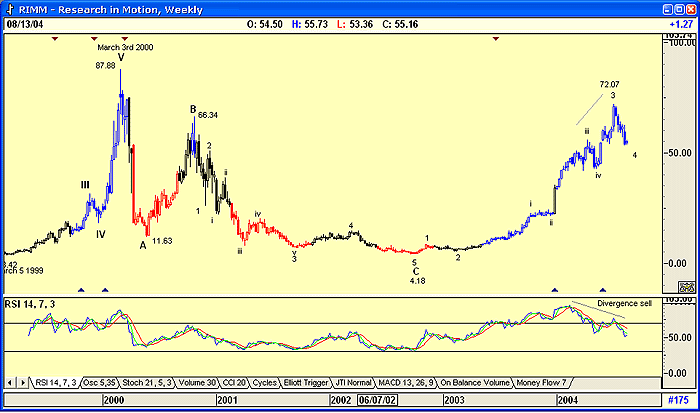
| Figure 1: RIM's weekly chart: this is BlackBerry. . . |
| Graphic provided by: AdvancedGET. |
| |
| When you look at a weekly chart of RIM, the tremendous volatility of the stock price hits you between the eyes. Here is a stock that moved from $3.42 on March 5th to $87.88 in one year. What a win! Assuming that this rise culminated in a WAVE 5, and the wave count over the short time frame is open to opinion, you can assume that the fall from this date would be in an ABC correction, and indeed it is. Wave A fell to $11.63, Wave B rose to $66.34 and Wave C fell to $4.18 in a true 5-impulse wave pattern. From this level it rose to $72.07 on July 2nd, 2004. Those who read the chart correctly are smiling all the way to the bank. But note that at $72.07 the 14-week RSI would have given a very convincing divergence sell signal. |
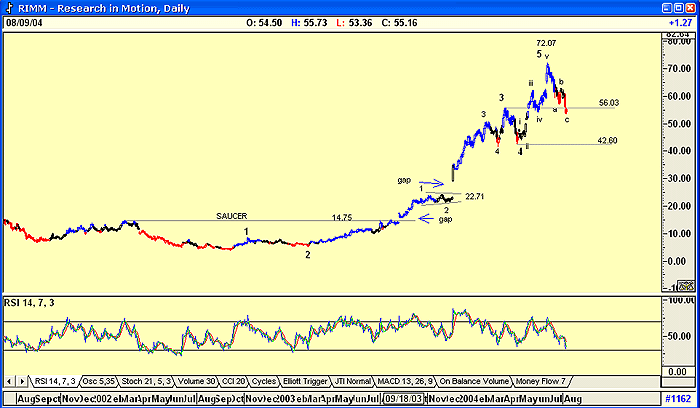
 Figure 2: Daily chart of RIM. A look at a daily chart shows a large saucer formation. It could be successfully argued that this is a cup and handle formation, but I prefer that the latter pattern form over a shorter time span. This saucer pattern would have indicated that the stock was in recovery mode after a dramatic fall. Indeed, the price broke above the resistance level at 14.75 on a gap. It then moved up and formed a consolidation triangle at $22.71, breaking out on a large gap. My wave count on the daily chart suggests that the wave structure is complete, and the ABC correction will take it to the fourth wave of lesser degree, namely the range between $42.60 and $56.03. The RSI is suggesting there is still some downside to go. What about the future? Here I would wait for the RSI indicator to fall below the 30 level, and then move above it. Rather than catch a falling knife, I prefer to buy a stock only after it is moving upwards in a rising trend. I would wait for a break above the upper band of the JM internal band indicator. A JM internal band is a 15-period simple moving average offset by 2% positive and 2% negative. A break above the upper band constitutes a buy signal, and a move below the lower band a sell signal. |
| To conclude, RIM is not a buy. . . yet. I would wait for the RSI to give a buy signal and the price to break above the upper JM band before buying. The fact that the weekly chart suggests that the current trend is a 4th wave correction, and the daily chart suggests an ABC correction with a 5-impulse wave rise once the correction is complete, suggests that the fifth wave of the weekly chart could indeed be very profitable. The share is in my "watch me" portfolio. |
Has been a technical analyst since 1969, and has worked as a futures and options trader with First Financial Futures in Johannesburg, South Africa.
| Address: | 3256 West 24th Ave |
| Vancouver, BC | |
| Phone # for sales: | 6042634214 |
| E-mail address: | petroosp@gmail.com |
Click here for more information about our publications!
PRINT THIS ARTICLE

Request Information From Our Sponsors
- StockCharts.com, Inc.
- Candle Patterns
- Candlestick Charting Explained
- Intermarket Technical Analysis
- John Murphy on Chart Analysis
- John Murphy's Chart Pattern Recognition
- John Murphy's Market Message
- MurphyExplainsMarketAnalysis-Intermarket Analysis
- MurphyExplainsMarketAnalysis-Visual Analysis
- StockCharts.com
- Technical Analysis of the Financial Markets
- The Visual Investor
- VectorVest, Inc.
- Executive Premier Workshop
- One-Day Options Course
- OptionsPro
- Retirement Income Workshop
- Sure-Fire Trading Systems (VectorVest, Inc.)
- Trading as a Business Workshop
- VectorVest 7 EOD
- VectorVest 7 RealTime/IntraDay
- VectorVest AutoTester
- VectorVest Educational Services
- VectorVest OnLine
- VectorVest Options Analyzer
- VectorVest ProGraphics v6.0
- VectorVest ProTrader 7
- VectorVest RealTime Derby Tool
- VectorVest Simulator
- VectorVest Variator
- VectorVest Watchdog
