HOT TOPICS LIST
- MACD
- Fibonacci
- RSI
- Gann
- ADXR
- Stochastics
- Volume
- Triangles
- Futures
- Cycles
- Volatility
- ZIGZAG
- MESA
- Retracement
- Aroon
INDICATORS LIST
LIST OF TOPICS
PRINT THIS ARTICLE
by Kevin Hopson
Natural gas has corrected significantly since the May high but prices could be due for a bounce in the near-term.
Position: N/A
Kevin Hopson
Kevin has been a technical analyst for roughly 10 years now. Previously, Kevin owned his own business and acted as a registered investment advisor, specializing in energy. He was also a freelance oil analyst for Orient Trading Co., a commodity futures trading firm in Japan. Kevin is currently a freelance writer.
PRINT THIS ARTICLE
TECHNICAL ANALYSIS
Is Natural Gas Ready For A Bounce?
08/10/04 10:44:42 AMby Kevin Hopson
Natural gas has corrected significantly since the May high but prices could be due for a bounce in the near-term.
Position: N/A
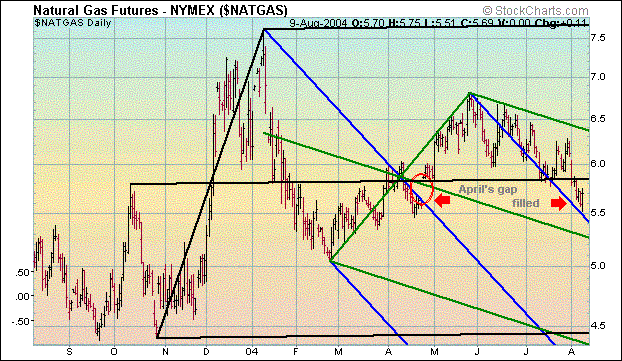
| The last time I touched on natural gas, I said that prices were entering a significant point in time, as a long-term downtrend line and a long-term uptrend line were both converging in the $6.00 to $7.00 range. A break above the $7.00 level would be bullish, while a break below the $6.00 level would be bearish. As you can see in the one-year chart, prices eventually broke to the downside, turning the technicals bearish. |
| However, if you take a closer look, natural gas prices could see a bounce in the near-term. Notice how prices previously found support around the $5.85 level, the site of the black median line. Natural gas had traded above this median line for over three months and the break of support here was a sign of further weakness. However, the top blue parallel line has been acting as support since the mid-June pullback and prices bounced off this trendline on August 9th. Additionally, April's upside gap ($5.65-$5.85) was filled upon the recent test of the top blue parallel line. Once gaps are filled, prices tend to move in the direction of the original gap - which in this case is up. |

|
| Graphic provided by: Stockcharts.com. |
| |
| The option open interest shows further support for a potential bounce. The September $5.50 strike price has the most amount of put open interest out of any front-month contract, and there are 7,737 put contracts at this strike price and only 2,115 call contracts (5,622 net put position). Since option activity tends to be a contrarian indicator, as sellers of put options will have incentive to keep prices above the related strike price (and vice-versa), natural gas should find significant support around the $5.50 level. If not, the build-up of put open interest at this strike price could work in reverse and lead to panic selling. As a result, I would keep a close eye on the $5.50 level in the near-term. |
Kevin has been a technical analyst for roughly 10 years now. Previously, Kevin owned his own business and acted as a registered investment advisor, specializing in energy. He was also a freelance oil analyst for Orient Trading Co., a commodity futures trading firm in Japan. Kevin is currently a freelance writer.
| Glen Allen, VA | |
| E-mail address: | hopson_1@yahoo.com |
Click here for more information about our publications!
Comments

Request Information From Our Sponsors
- StockCharts.com, Inc.
- Candle Patterns
- Candlestick Charting Explained
- Intermarket Technical Analysis
- John Murphy on Chart Analysis
- John Murphy's Chart Pattern Recognition
- John Murphy's Market Message
- MurphyExplainsMarketAnalysis-Intermarket Analysis
- MurphyExplainsMarketAnalysis-Visual Analysis
- StockCharts.com
- Technical Analysis of the Financial Markets
- The Visual Investor
- VectorVest, Inc.
- Executive Premier Workshop
- One-Day Options Course
- OptionsPro
- Retirement Income Workshop
- Sure-Fire Trading Systems (VectorVest, Inc.)
- Trading as a Business Workshop
- VectorVest 7 EOD
- VectorVest 7 RealTime/IntraDay
- VectorVest AutoTester
- VectorVest Educational Services
- VectorVest OnLine
- VectorVest Options Analyzer
- VectorVest ProGraphics v6.0
- VectorVest ProTrader 7
- VectorVest RealTime Derby Tool
- VectorVest Simulator
- VectorVest Variator
- VectorVest Watchdog
