HOT TOPICS LIST
- MACD
- Fibonacci
- RSI
- Gann
- ADXR
- Stochastics
- Volume
- Triangles
- Futures
- Cycles
- Volatility
- ZIGZAG
- MESA
- Retracement
- Aroon
INDICATORS LIST
LIST OF TOPICS
PRINT THIS ARTICLE
by David Penn
After breaking down from an intraday triangle, prices rallied back toward the breakdown point in a classic example of support turning into resistance.
Position: N/A
David Penn
Technical Writer for Technical Analysis of STOCKS & COMMODITIES magazine, Working-Money.com, and Traders.com Advantage.
PRINT THIS ARTICLE
SUPPORT & RESISTANCE
Dr. Resistance And Mr. Support
08/10/04 12:11:15 PMby David Penn
After breaking down from an intraday triangle, prices rallied back toward the breakdown point in a classic example of support turning into resistance.
Position: N/A
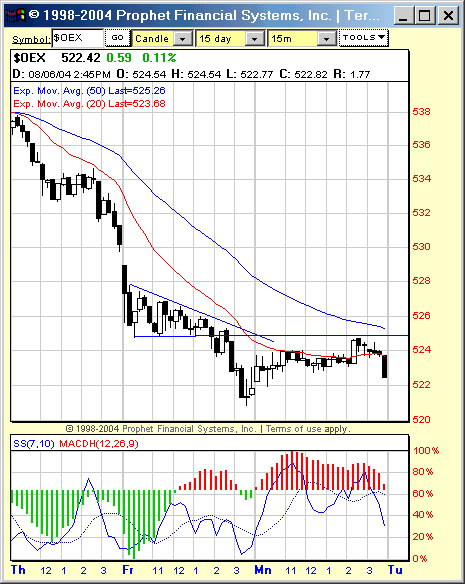
| While it might not have been as exciting as watching a turn of the century apothecary turn into a raving madman by way of a strange and mysterious elixir, the markets on Monday provided an excellent lesson (and no small entertainment) on the principles of support and resistance. In particular, intraday price action in the S&P 100 ($OEX) over the past two days has shown us both how support works as well as how, when support fails, that same support level often becomes resistance. |
| In a recent piece for Traders.com Advantage ("Gone With The Triangle," August 6, 2004), I noted an intraday descending triangle in the $OEX. This triangle, with a high point near 528 and horizontal support at 525, suggested that the $OEX would have further to fall. Recall that the $OEX had been declining for some days -- as I noted in another Traders.com Advantage article ("The Head And The Shoulders," August 5, 2004). So the $OEX was in a downtrend when the descending triangle developed and my reading of this triangle suggested that there was more downside to come. |

|
| Late on Monday, the $OEX retreats from resistance at 525--a resistance level created by the broken support at the bottom of the descending triangle. |
| Graphic provided by: Prophet Financial Systems, Inc. |
| |
| As "Gone With The Triangle" showed, prices did in fact breakdown below support at 525. In fact, they fell as low as 520.83 late on Friday, August 6th before bouncing somewhat into the close. On Monday, the $OEX began rising, but quickly began moving sideways as the day progressed. This sideways action, it appears, is a reaction to the resistance level at 525, a resistance level created from the descending triangle. This level, of course, is the same level at which prices found support during the formation of the descending triangle on Friday the 6th. |
| Sure enough, prices rallied in the afternoon on Monday, challenging the 525 level. But after moving as high as 524.73, the $OEX retreated sharply, moving to finish the day sharply lower. |
| One note: While I was relatively confident that the 525 level wouldn't be breached, it didn't hurt to have a building negative divergence between the consecutively lower peaks in the 7, 10 stochastic and the consecutively higher peaks in the $OEX Monday afternoon. While prices have "denied" such divergences for a little while (see my Traders.com Advantage articles "Denying The Divergence" from June 29 and "Return Of The Son Of Denying The Divergence" from August 4), divergences continue to win the way and point toward the true direction more often than not. Combined with the notion of past support become resistance, the negative divergences seemed worth heeding. And at approximately 2:45 p.m. on Monday, the market did just that. Full disclosure: Author is long $OEX puts as of this writing. |
Technical Writer for Technical Analysis of STOCKS & COMMODITIES magazine, Working-Money.com, and Traders.com Advantage.
| Title: | Technical Writer |
| Company: | Technical Analysis, Inc. |
| Address: | 4757 California Avenue SW |
| Seattle, WA 98116 | |
| Phone # for sales: | 206 938 0570 |
| Fax: | 206 938 1307 |
| Website: | www.Traders.com |
| E-mail address: | DPenn@traders.com |
Traders' Resource Links | |
| Charting the Stock Market: The Wyckoff Method -- Books | |
| Working-Money.com -- Online Trading Services | |
| Traders.com Advantage -- Online Trading Services | |
| Technical Analysis of Stocks & Commodities -- Publications and Newsletters | |
| Working Money, at Working-Money.com -- Publications and Newsletters | |
| Traders.com Advantage -- Publications and Newsletters | |
| Professional Traders Starter Kit -- Software | |
Click here for more information about our publications!
PRINT THIS ARTICLE

Request Information From Our Sponsors
- VectorVest, Inc.
- Executive Premier Workshop
- One-Day Options Course
- OptionsPro
- Retirement Income Workshop
- Sure-Fire Trading Systems (VectorVest, Inc.)
- Trading as a Business Workshop
- VectorVest 7 EOD
- VectorVest 7 RealTime/IntraDay
- VectorVest AutoTester
- VectorVest Educational Services
- VectorVest OnLine
- VectorVest Options Analyzer
- VectorVest ProGraphics v6.0
- VectorVest ProTrader 7
- VectorVest RealTime Derby Tool
- VectorVest Simulator
- VectorVest Variator
- VectorVest Watchdog
- StockCharts.com, Inc.
- Candle Patterns
- Candlestick Charting Explained
- Intermarket Technical Analysis
- John Murphy on Chart Analysis
- John Murphy's Chart Pattern Recognition
- John Murphy's Market Message
- MurphyExplainsMarketAnalysis-Intermarket Analysis
- MurphyExplainsMarketAnalysis-Visual Analysis
- StockCharts.com
- Technical Analysis of the Financial Markets
- The Visual Investor
