HOT TOPICS LIST
- MACD
- Fibonacci
- RSI
- Gann
- ADXR
- Stochastics
- Volume
- Triangles
- Futures
- Cycles
- Volatility
- ZIGZAG
- MESA
- Retracement
- Aroon
INDICATORS LIST
LIST OF TOPICS
PRINT THIS ARTICLE
by Kevin Hopson
The Oil Services Index and AMEX Oil Index could be due for a bounce.
Position: N/A
Kevin Hopson
Kevin has been a technical analyst for roughly 10 years now. Previously, Kevin owned his own business and acted as a registered investment advisor, specializing in energy. He was also a freelance oil analyst for Orient Trading Co., a commodity futures trading firm in Japan. Kevin is currently a freelance writer.
PRINT THIS ARTICLE
TECHNICAL ANALYSIS
Oil And Gas Stocks Approaching Key Support
08/09/04 01:45:34 PMby Kevin Hopson
The Oil Services Index and AMEX Oil Index could be due for a bounce.
Position: N/A
| There are three primary indices that measure the performance of oil and gas stocks - the Oil Services Index (OSX), the AMEX Oil Index (XOI) and the AMEX Natural Gas Index (XNG). However, because some members of the XNG are utility companies and not true exploration and production (E&P) companies, I will focus on the OSX and XOI instead, as I believe these two indices better represent the industry. |
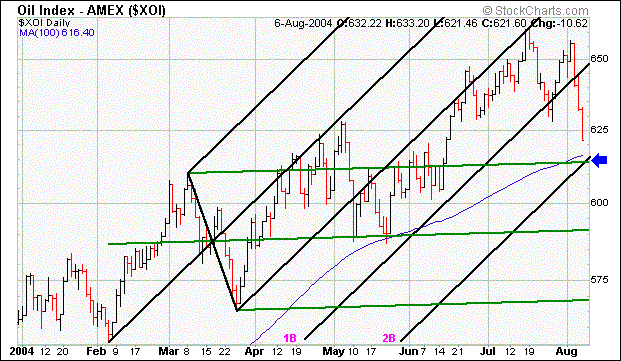
| Looking at the year-to-date chart for the XOI, a price-weighted index of integrated oil companies, you will notice that $615 is a key support level for this group. It is the site of the 61.8 percent retracement level from the May-July rally and the index's 100-day moving average ($616.40). This is also the site of the 2B channel line and the top green parallel line. As a result, despite the recent sell-off in the XOI (and overall market), the technical damage has been minimal. |

|
| Figure 1: AMEX Oil Index ($XOI). |
| Graphic provided by: Stockcharts.com. |
| |
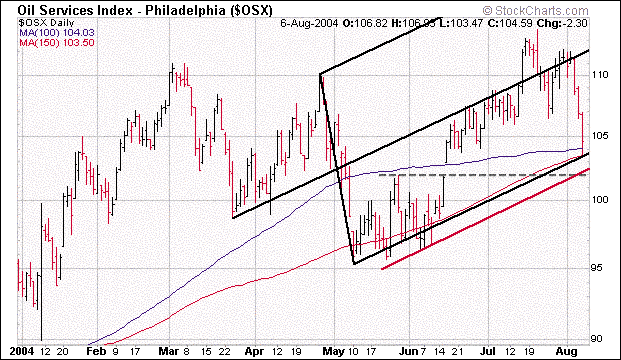
| The same goes for the Oil Services Index, where the year-to-date chart of the OSX has key support in the $102 to $104 range. This is also the site of the 61.8 percent retracement level from the May-July rally, as well as the index's 100-day ($104.03) and 150-day ($103.50) moving averages. Just to note, the index bounced off these moving averages on Friday. This is also where the bottom black parallel line, the sliding red parallel line and June's double top breakout (unfilled gap) occur. |
 Figure 2: Philadelphia OSX. However, from a market sentiment standpoint, I believe oil service stocks are better positioned than integrated oil stocks in the near-term. Oil service stocks - as measured by the OSX - saw short interest climb by 5.5 percent last month, giving a short interest ratio for the group of 4.2x. On the other hand, Integrated oil stocks saw short interest decline by 8.9 percent, while the short interest ratio for the group stands at a meager 2.5x. |
| This means that oil service stocks have more potential buying pressure in the near-term, which could help the group rebound from the recent sell-off. Additionally, referring back to my January article on the OSX, I have a long-term price target of $132 for the index. Given the recent price movement, I would continue to accumulate shares of oil service stocks in anticipation of higher long-term prices. In terms of integrated oil stocks, I would hold and await further developments. |
Kevin has been a technical analyst for roughly 10 years now. Previously, Kevin owned his own business and acted as a registered investment advisor, specializing in energy. He was also a freelance oil analyst for Orient Trading Co., a commodity futures trading firm in Japan. Kevin is currently a freelance writer.
| Glen Allen, VA | |
| E-mail address: | hopson_1@yahoo.com |
Click here for more information about our publications!
PRINT THIS ARTICLE

Request Information From Our Sponsors
- VectorVest, Inc.
- Executive Premier Workshop
- One-Day Options Course
- OptionsPro
- Retirement Income Workshop
- Sure-Fire Trading Systems (VectorVest, Inc.)
- Trading as a Business Workshop
- VectorVest 7 EOD
- VectorVest 7 RealTime/IntraDay
- VectorVest AutoTester
- VectorVest Educational Services
- VectorVest OnLine
- VectorVest Options Analyzer
- VectorVest ProGraphics v6.0
- VectorVest ProTrader 7
- VectorVest RealTime Derby Tool
- VectorVest Simulator
- VectorVest Variator
- VectorVest Watchdog
- StockCharts.com, Inc.
- Candle Patterns
- Candlestick Charting Explained
- Intermarket Technical Analysis
- John Murphy on Chart Analysis
- John Murphy's Chart Pattern Recognition
- John Murphy's Market Message
- MurphyExplainsMarketAnalysis-Intermarket Analysis
- MurphyExplainsMarketAnalysis-Visual Analysis
- StockCharts.com
- Technical Analysis of the Financial Markets
- The Visual Investor
