HOT TOPICS LIST
- MACD
- Fibonacci
- RSI
- Gann
- ADXR
- Stochastics
- Volume
- Triangles
- Futures
- Cycles
- Volatility
- ZIGZAG
- MESA
- Retracement
- Aroon
INDICATORS LIST
LIST OF TOPICS
PRINT THIS ARTICLE
by David Penn
That's the answer. The question? Where did any hope of a week-ending rally in the $OEX go?
Position: N/A
David Penn
Technical Writer for Technical Analysis of STOCKS & COMMODITIES magazine, Working-Money.com, and Traders.com Advantage.
PRINT THIS ARTICLE
DESCENDING TRIANGLES
Gone With The Triangle
08/09/04 08:14:02 AMby David Penn
That's the answer. The question? Where did any hope of a week-ending rally in the $OEX go?
Position: N/A
| Yesterday (August 5th) I submitted a Traders.com Advantage article discussing the intraday head and shoulders top on August 2nd that threatened lower prices in the $OEX ("The Head And The Shoulders," August 5, 2004, Traders.com Advantage). While that article might get posted for your perusal any minute now, suffice it to say that the $OEX pulled back to neckline support-turned-resistance at about 535 after breaking out, then resumed its decent. |
| In the above-mentioned article, I suggested an immediate downside to 528.50. That target was more than reached early Friday morning, as the $OEX opened down and continued to move downward throughout Friday's session. |

|
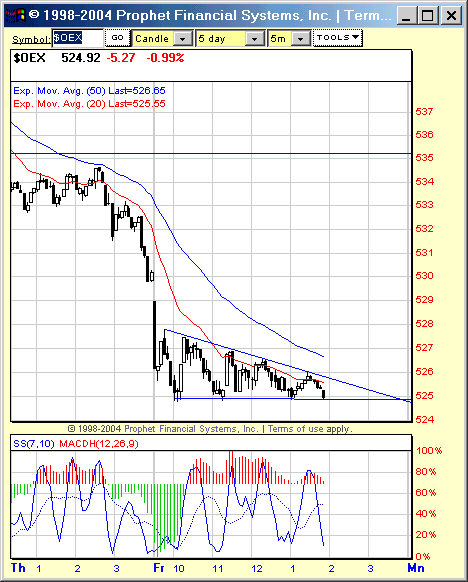
| Figure 1: This descending triangle developed as the $OEX plummeted toward year-to-date lows. |
| Graphic provided by: Prophet Financial Systems, Inc.. |
| |
| Toward the middle of the afternoon, the $OEX -- along with other markets -- stalled briefly. Traders who had been watching the markets since the topping process began this year could have been forgiven for fearing that here was another instance in which "somebody would push a button" and send the market on one of its infamous, late-in-the-day rallies, squeezing shorts and making bulls giddy with the scent of their own fortunes. |
| However, a close look at this consolidation formation would have revealed to the discriminating analyst a descending triangle. Note how in each hour there is a slightly lower peak -- I count five of them, literally one in each hour leading up to the breakdown. At the same time, the declines from these peaks seemed to have found support at a more or less common level -- 525. This combination of consecutively lower peaks and a flat (or nearly flat) support level often results in a descending triangle. The descending triangle is typically a continuation pattern -- though some have argued persuasively for descending triangle tops (arguably the major markets are creating just these kind of tops right now -- particularly the $OEX and $SPX). As such, traders should have been on the lookout for a breakdown rather than a breakout . |
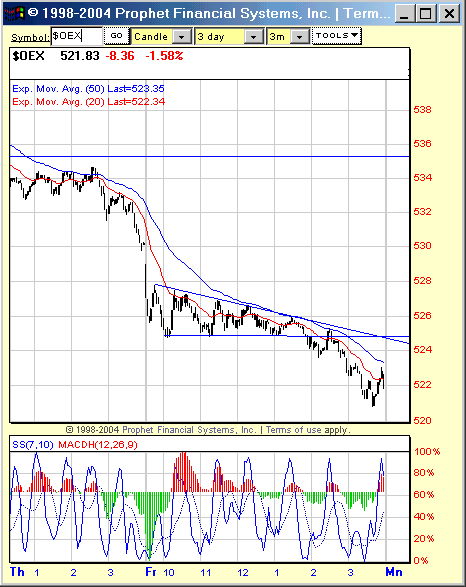
 Figure 2. The breakdown from this intraday descending triangle reached its minimum downside objective within an hour after slipping from the formation. And a breakdown was precisely what they got. The size of the triangle at its widest point was approximately four points which, when subtracted from the value at the level of the breakout, provides the minimum downside objective. |
Technical Writer for Technical Analysis of STOCKS & COMMODITIES magazine, Working-Money.com, and Traders.com Advantage.
| Title: | Technical Writer |
| Company: | Technical Analysis, Inc. |
| Address: | 4757 California Avenue SW |
| Seattle, WA 98116 | |
| Phone # for sales: | 206 938 0570 |
| Fax: | 206 938 1307 |
| Website: | www.Traders.com |
| E-mail address: | DPenn@traders.com |
Traders' Resource Links | |
| Charting the Stock Market: The Wyckoff Method -- Books | |
| Working-Money.com -- Online Trading Services | |
| Traders.com Advantage -- Online Trading Services | |
| Technical Analysis of Stocks & Commodities -- Publications and Newsletters | |
| Working Money, at Working-Money.com -- Publications and Newsletters | |
| Traders.com Advantage -- Publications and Newsletters | |
| Professional Traders Starter Kit -- Software | |
Click here for more information about our publications!
PRINT THIS ARTICLE

Request Information From Our Sponsors
- StockCharts.com, Inc.
- Candle Patterns
- Candlestick Charting Explained
- Intermarket Technical Analysis
- John Murphy on Chart Analysis
- John Murphy's Chart Pattern Recognition
- John Murphy's Market Message
- MurphyExplainsMarketAnalysis-Intermarket Analysis
- MurphyExplainsMarketAnalysis-Visual Analysis
- StockCharts.com
- Technical Analysis of the Financial Markets
- The Visual Investor
- VectorVest, Inc.
- Executive Premier Workshop
- One-Day Options Course
- OptionsPro
- Retirement Income Workshop
- Sure-Fire Trading Systems (VectorVest, Inc.)
- Trading as a Business Workshop
- VectorVest 7 EOD
- VectorVest 7 RealTime/IntraDay
- VectorVest AutoTester
- VectorVest Educational Services
- VectorVest OnLine
- VectorVest Options Analyzer
- VectorVest ProGraphics v6.0
- VectorVest ProTrader 7
- VectorVest RealTime Derby Tool
- VectorVest Simulator
- VectorVest Variator
- VectorVest Watchdog
