HOT TOPICS LIST
- MACD
- Fibonacci
- RSI
- Gann
- ADXR
- Stochastics
- Volume
- Triangles
- Futures
- Cycles
- Volatility
- ZIGZAG
- MESA
- Retracement
- Aroon
INDICATORS LIST
LIST OF TOPICS
PRINT THIS ARTICLE
by David Penn
The market sold into the Democratic national convention and rallied during and out of it. Does the hourly head and shoulders top in the $OEX mean that a similar market move will take place in advance of the GOP convention in August?
Position: N/A
David Penn
Technical Writer for Technical Analysis of STOCKS & COMMODITIES magazine, Working-Money.com, and Traders.com Advantage.
PRINT THIS ARTICLE
HEAD & SHOULDERS
The Head And The Shoulders
08/05/04 11:57:35 AMby David Penn
The market sold into the Democratic national convention and rallied during and out of it. Does the hourly head and shoulders top in the $OEX mean that a similar market move will take place in advance of the GOP convention in August?
Position: N/A
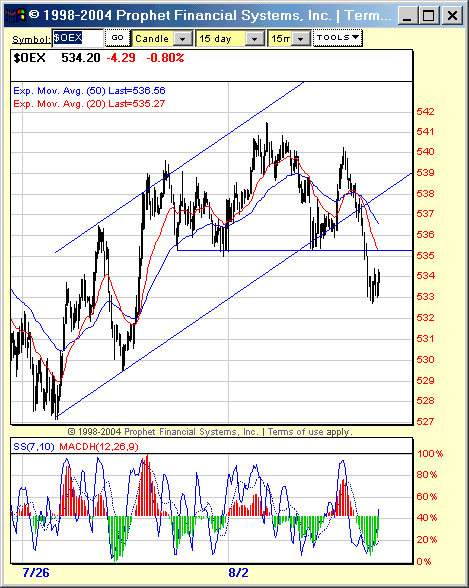
| In a recent article about the late July rally in the $OEX, I made the case for the S&P 100 to move lower ("Return of the Son of Denying the Divergence," Traders.com Advantage, August 4, 2004). Up-to-date price action has confirmed that bearish outlook and, further, has revealed a head and shoulders top in hourly charts of the $OEX that suggests both more downside and, potentially, where support might develop once the decline from the head and shoulders top is complete. |
| The head and shoulders top in the hourly $OEX began on the 29th of July, with a short-term peak. This peak represented the left shoulder of the pattern. The head formed over the course of August 2nd and 3rd, and the right shoulder was formed by the short-term peak that developed in the afternoon of August 4th. |

|
| This head and shoulders top in the hourly $OEX suggests a return to the July lows near 527. |
| Graphic provided by: Prophet Financial Systems, Inc.. |
| |
| The breakdown from this head and shoulders top was swift, as the chart above shows. At present, the $OEX is consolidating, and is likely to make a move back up toward the neckline resistance area just north of 535. I don't expect that this bounce will be particularly strong. In part, this is because the $OEX isn't at a major support level right now, a support level that would help propel any bounce in the $OEX higher. The other reason is that the neckline near 535 -- and the 20-bar exponential moving average, for that matter -- should provide for strong resistance. |
| What sort of downside does this hourly head and shoulders top project? With a formation top at 541.50 and a neckline at 535, traders should expect a drop to at least 528.50 in an initial move down. Such a decline, by the way, would represent a serious test of year-to-date lows, lows that have held up (to a degree, at least) on two other occasions in March and May. |
| Those interested in my running (to keep up) Elliott wave count, may recall that I warned that the count discussed in "Journey to the End of the Diagonal," (Traders.com Advantage, July 28, 2004) would be invalidated if the rally in the $OEX climbed above 544. So far, that appears as if it will not be the case. As such, we can consider the wave 2 rally (the "Democratic convention rally" if you will) most likely to be over. What should follow is a fairly severe wave 3 correction. By my accounting, this "hourly" third wave is a part of a larger third wave correction that began in late June. Full disclosure: Author is long $OEX puts as of this writing. |
Technical Writer for Technical Analysis of STOCKS & COMMODITIES magazine, Working-Money.com, and Traders.com Advantage.
| Title: | Technical Writer |
| Company: | Technical Analysis, Inc. |
| Address: | 4757 California Avenue SW |
| Seattle, WA 98116 | |
| Phone # for sales: | 206 938 0570 |
| Fax: | 206 938 1307 |
| Website: | www.Traders.com |
| E-mail address: | DPenn@traders.com |
Traders' Resource Links | |
| Charting the Stock Market: The Wyckoff Method -- Books | |
| Working-Money.com -- Online Trading Services | |
| Traders.com Advantage -- Online Trading Services | |
| Technical Analysis of Stocks & Commodities -- Publications and Newsletters | |
| Working Money, at Working-Money.com -- Publications and Newsletters | |
| Traders.com Advantage -- Publications and Newsletters | |
| Professional Traders Starter Kit -- Software | |
Click here for more information about our publications!
PRINT THIS ARTICLE

Request Information From Our Sponsors
- StockCharts.com, Inc.
- Candle Patterns
- Candlestick Charting Explained
- Intermarket Technical Analysis
- John Murphy on Chart Analysis
- John Murphy's Chart Pattern Recognition
- John Murphy's Market Message
- MurphyExplainsMarketAnalysis-Intermarket Analysis
- MurphyExplainsMarketAnalysis-Visual Analysis
- StockCharts.com
- Technical Analysis of the Financial Markets
- The Visual Investor
- VectorVest, Inc.
- Executive Premier Workshop
- One-Day Options Course
- OptionsPro
- Retirement Income Workshop
- Sure-Fire Trading Systems (VectorVest, Inc.)
- Trading as a Business Workshop
- VectorVest 7 EOD
- VectorVest 7 RealTime/IntraDay
- VectorVest AutoTester
- VectorVest Educational Services
- VectorVest OnLine
- VectorVest Options Analyzer
- VectorVest ProGraphics v6.0
- VectorVest ProTrader 7
- VectorVest RealTime Derby Tool
- VectorVest Simulator
- VectorVest Variator
- VectorVest Watchdog
