

HOT TOPICS LIST
- MACD
- Fibonacci
- RSI
- Gann
- ADXR
- Stochastics
- Volume
- Triangles
- Futures
- Cycles
- Volatility
- ZIGZAG
- MESA
- Retracement
- Aroon
INDICATORS LIST
LIST OF TOPICS
PRINT THIS ARTICLE
by Kevin Hopson
The Nasdaq 100 shares have bounced off the $34.00 level several times the past year but the current consolidation pattern may point to a break of support here.
Position: N/A
Kevin Hopson
Kevin has been a technical analyst for roughly 10 years now. Previously, Kevin owned his own business and acted as a registered investment advisor, specializing in energy. He was also a freelance oil analyst for Orient Trading Co., a commodity futures trading firm in Japan. Kevin is currently a freelance writer.
PRINT THIS ARTICLE
TECHNICAL ANALYSIS
A Bearish Trading Range For The Nasdaq 100?
08/05/04 08:24:04 AMby Kevin Hopson
The Nasdaq 100 shares have bounced off the $34.00 level several times the past year but the current consolidation pattern may point to a break of support here.
Position: N/A
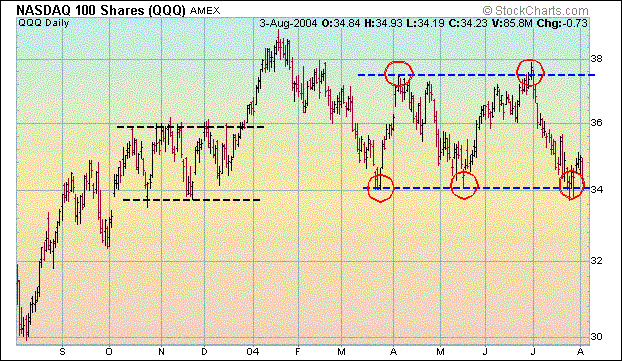
| The last time I touched on the Nasdaq 100 shares (QQQ) was in early January. At that time, I recommended accumulating shares in anticipation of higher prices. Prices had broken out of a three-month trading range, as illustrated by the dotted black lines. My price target - based on the trading range breakout - was $40.00 to $42.00. However, the shares never reached my upside target, and prices eventually reversed around the $39.00 level. |
| Since bottoming out in March, prices have moved sideways and have been stuck in a trading range between the $34.00 and $37.50 levels, as illustrated by the dotted blue lines. As I have mentioned in many of my prior articles, trading ranges tend to be continuation patterns. Unfortunately for the Nasdaq 100 shares, this trading range developed after a sharp move down; so the expected break would be to the downside. |
|
| Graphic provided by: Stockcharts.com. |
| |
| Notice how prices failed to test January's high during the subsequent rallies. If they had, the top of the trading range would be around $39.00 and the continuation (or breakout) would likely be to the upside. However, since the bottom channel line formed after the January-March decline and the rallies have topped out around $37.50, the trading range appears to be bearish. |
| Additionally, market sentiment towards the Nasdaq 100 shares continues to be overly optimistic. The put/call open interest ratio (for the front three months) is currently 1.03. Even though this means that put and call open interest for the front three months is fairly even, this ratio has come down from 1.93 earlier this year, putting it at its lowest level in a year. The decline in the put/call open interest ratio has occurred despite much weaker prices the past month, and until investors become much more pessimistic, shares of the Nasdaq 100 will likely have further room to fall. |
| If prices do break to the downside from the current trading range, a potential target is $23.50 to $27.00. I calculated this target by taking the number of times that prices have tested the bottom channel line in alternate sequence, multiplying this figure (3) by the width of the trading range ($37.50 - $34.00 = $3.50) and then subtracting this number ($3.50 x 3 = $10.50) from the top ($37.50 - $10.50 = $27.00) and bottom ($34.00 - $10.50 = $23.50) channel lines. This assumes that prices will break to the downside without testing the top channel line again. Prices tend to break in the direction of the fifth trading range test, which happens to be the bottom channel line. As a result, I would consider a significant breach of support around the $34.00 level - where prices have bottomed several times since last October - as a signal to go short. |
Kevin has been a technical analyst for roughly 10 years now. Previously, Kevin owned his own business and acted as a registered investment advisor, specializing in energy. He was also a freelance oil analyst for Orient Trading Co., a commodity futures trading firm in Japan. Kevin is currently a freelance writer.
| Glen Allen, VA | |
| E-mail address: | hopson_1@yahoo.com |
Click here for more information about our publications!
Comments
Date:�08/06/04Rank:�4Comment:�

Request Information From Our Sponsors
- StockCharts.com, Inc.
- Candle Patterns
- Candlestick Charting Explained
- Intermarket Technical Analysis
- John Murphy on Chart Analysis
- John Murphy's Chart Pattern Recognition
- John Murphy's Market Message
- MurphyExplainsMarketAnalysis-Intermarket Analysis
- MurphyExplainsMarketAnalysis-Visual Analysis
- StockCharts.com
- Technical Analysis of the Financial Markets
- The Visual Investor
- VectorVest, Inc.
- Executive Premier Workshop
- One-Day Options Course
- OptionsPro
- Retirement Income Workshop
- Sure-Fire Trading Systems (VectorVest, Inc.)
- Trading as a Business Workshop
- VectorVest 7 EOD
- VectorVest 7 RealTime/IntraDay
- VectorVest AutoTester
- VectorVest Educational Services
- VectorVest OnLine
- VectorVest Options Analyzer
- VectorVest ProGraphics v6.0
- VectorVest ProTrader 7
- VectorVest RealTime Derby Tool
- VectorVest Simulator
- VectorVest Variator
- VectorVest Watchdog