HOT TOPICS LIST
- MACD
- Fibonacci
- RSI
- Gann
- ADXR
- Stochastics
- Volume
- Triangles
- Futures
- Cycles
- Volatility
- ZIGZAG
- MESA
- Retracement
- Aroon
INDICATORS LIST
LIST OF TOPICS
PRINT THIS ARTICLE
by David Penn
A one-day island reversal in shares of Goldman Sachs points to lower prices going forward.
Position: N/A
David Penn
Technical Writer for Technical Analysis of STOCKS & COMMODITIES magazine, Working-Money.com, and Traders.com Advantage.
PRINT THIS ARTICLE
GAPS
Gap Counter Gap
08/03/04 01:27:19 PMby David Penn
A one-day island reversal in shares of Goldman Sachs points to lower prices going forward.
Position: N/A
You know, Thomas Bulkowski's book, Encyclopedia of Chart Patterns, isn't just a must-have for any pattern recognition oriented technical analyst or trader -- it's also a fun read. And I'm not just talking about the "sample trades" of people Bulkowski knows who tried to profit from these patterns. Check out Bulkowski's discussion of the island gap:The performance of island reversals is perhaps surprising only for its mediocrity. |
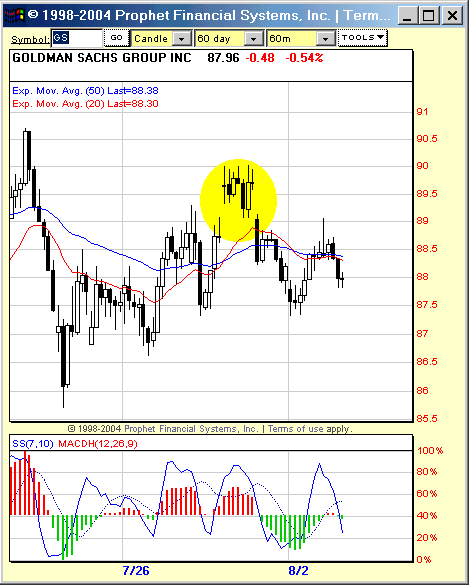
| The fact that Bulkowski then goes on to thoroughly discuss what island reversals are, how to spot them and what kind of profit potential these patterns have is a testament to the man's sense of duty to the field of technical analysis. In acknowledging how easy island reversals are to spot, Bulkowski is forgiving the rest of us for salivating like bird dogs every time we see one. Mediocre or not, let's take a look at an island reversal that has formed in shares of big-time broker, Goldman Sachs (GS). Although I suggested at the outset that this gap was a one-day affair (which it was), seeing the island gap in action really requires looking at any intraday chart, such as the hourly chart provided here. |

|
| Ths island reversal gap in the hourly chart of Goldman Sachs suggests a retest of recent lows south of 85. |
| Graphic provided by: Prophet Financial Systems, Inc.. |
| |
| Generally, Bulkowski tells us that island tops tend to arrive at the end of a rising price trend, such as the one seen here. They are formed when prices gap up then gap back down, leaving a price gap that is more or less at the same level during both the gap up and gap down phases. While not an especially common form of reversal, the fact that gaps often reveal exhaustion or strength makes island reversals potentially powerful reversal patterns indeed. Essentially, in the best case scenario, an island gap is created by an exhaustion gap up and a breakaway gap back down. |
| How are island tops best played? One rule of thumb provided by Thomas Bulkowski is that prices must retreat by at least 5% from the second gap (the gap down) before an island top can be confirmed. In this case, the 5% rule would require Goldman Sachs to fall to 84.55 before the island top could be confirmed. However, another trading tactic suggested by Bulkowski is more helpful. This rule calls for traders to wait for a bounce after the initial post-gap break. This bounce might involve filling the gap, which is also positive for the new trend. Looking at the hourly chart of GS, the shooting star-like candlestick on the morning of August 3rd appears to represent the extent of the bounce (both in absolute price terms as well as in terms of the bearish reversal candlestick). |
| It should be mentioned that daily charts as of mid-day August 3rd are similarly indicating lower for Goldman Sachs -- particularly by virtue of the declining MACDH (which appears to have peaked out on August 2, for the time being). A test of the lows at about 85.75 seems more likely at this point than taking out the July highs at 94. |
Technical Writer for Technical Analysis of STOCKS & COMMODITIES magazine, Working-Money.com, and Traders.com Advantage.
| Title: | Technical Writer |
| Company: | Technical Analysis, Inc. |
| Address: | 4757 California Avenue SW |
| Seattle, WA 98116 | |
| Phone # for sales: | 206 938 0570 |
| Fax: | 206 938 1307 |
| Website: | www.Traders.com |
| E-mail address: | DPenn@traders.com |
Traders' Resource Links | |
| Charting the Stock Market: The Wyckoff Method -- Books | |
| Working-Money.com -- Online Trading Services | |
| Traders.com Advantage -- Online Trading Services | |
| Technical Analysis of Stocks & Commodities -- Publications and Newsletters | |
| Working Money, at Working-Money.com -- Publications and Newsletters | |
| Traders.com Advantage -- Publications and Newsletters | |
| Professional Traders Starter Kit -- Software | |
Click here for more information about our publications!
Comments
Date: 08/05/04Rank: 4Comment:

Request Information From Our Sponsors
- StockCharts.com, Inc.
- Candle Patterns
- Candlestick Charting Explained
- Intermarket Technical Analysis
- John Murphy on Chart Analysis
- John Murphy's Chart Pattern Recognition
- John Murphy's Market Message
- MurphyExplainsMarketAnalysis-Intermarket Analysis
- MurphyExplainsMarketAnalysis-Visual Analysis
- StockCharts.com
- Technical Analysis of the Financial Markets
- The Visual Investor
- VectorVest, Inc.
- Executive Premier Workshop
- One-Day Options Course
- OptionsPro
- Retirement Income Workshop
- Sure-Fire Trading Systems (VectorVest, Inc.)
- Trading as a Business Workshop
- VectorVest 7 EOD
- VectorVest 7 RealTime/IntraDay
- VectorVest AutoTester
- VectorVest Educational Services
- VectorVest OnLine
- VectorVest Options Analyzer
- VectorVest ProGraphics v6.0
- VectorVest ProTrader 7
- VectorVest RealTime Derby Tool
- VectorVest Simulator
- VectorVest Variator
- VectorVest Watchdog
