HOT TOPICS LIST
- MACD
- Fibonacci
- RSI
- Gann
- ADXR
- Stochastics
- Volume
- Triangles
- Futures
- Cycles
- Volatility
- ZIGZAG
- MESA
- Retracement
- Aroon
INDICATORS LIST
LIST OF TOPICS
PRINT THIS ARTICLE
by David Penn
A double negative divergence signaled a market top in June. Will another double negative divergence signal another top in August?
Position: N/A
David Penn
Technical Writer for Technical Analysis of STOCKS & COMMODITIES magazine, Working-Money.com, and Traders.com Advantage.
PRINT THIS ARTICLE
STOCHASTICS
Return Of The Son Of Denying The Divergence
08/04/04 02:14:01 PMby David Penn
A double negative divergence signaled a market top in June. Will another double negative divergence signal another top in August?
Position: N/A
| A little over a month ago, I wrote about the ability of the S&P 500 to advance in the face of multiple negative divergences ("Denying the Divergence," Traders.com Advantage, June 29, 2004). At the time, the S&P 500 had formed successively higher peaks on May 27th, June 8th, and June 24th (intraday). Simultaneously, however, the 7, 10 stochastic was forming a series of successively lower peaks. |
| At the time I wrote, "technicians who have come to love the certainty of divergences have been forced to confront the reality of a rally that may be close but is not yet ready to call it a day." The S&P broke down two days later. One month and 30 S&P 500 points later, we find a similar scenario developing -- only this time, the negative divergences appear on the hourly chart, as opposed to the daily. |

|
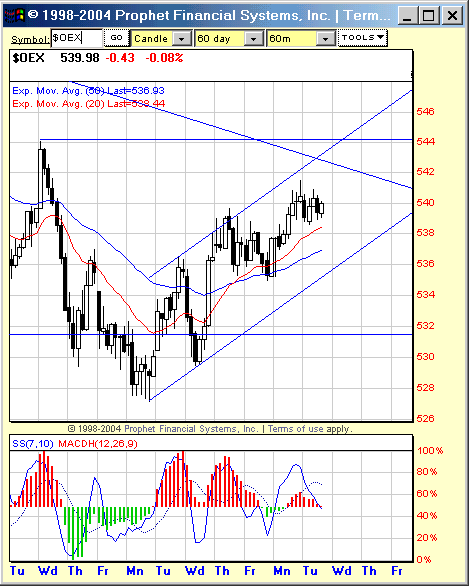
| A trio of successively lower stochastic peaks as the $OEX moves successively higher argues against a sustained advance. |
| Graphic provided by: Prophet Financial Systems, Inc. |
| |
| The $OEX, or S&P 100, has been in rally mode along with most of the market since the beginning of the Democratic convention. Given the size of the decline that preceded this rally (a decline most recently discussed in my Traders.com Advantage article, "Journey To The End Of The Diamond," from July 28, 2004) and the fact that prices were trading below the 20- and 50-hour exponential moving averages, most observers knew that any "bounce" would be just that -- a bounce. |
| And the growing negative divergence only underscores that interpretation. I had hesitated to mention this divergence until I saw the 7, 10 stochastic turn down on Tuesday, August 3rd. But with the stochastic turning down sharply so far this morning, it is clear that the third consecutively lower stochastic peak will arrive just as the $OEX is making its third consecutively higher hourly peak. |
| It took only a few days after the market made its second negative divergence in June for the market to break. If the future bears any resemblance to the past, then we should not be surprised if the present pair of hourly negative stochastic divergences results in a similarly downward outcome for the $OEX. Full disclosure: Author is long $OEX puts as of this writing. |
Technical Writer for Technical Analysis of STOCKS & COMMODITIES magazine, Working-Money.com, and Traders.com Advantage.
| Title: | Technical Writer |
| Company: | Technical Analysis, Inc. |
| Address: | 4757 California Avenue SW |
| Seattle, WA 98116 | |
| Phone # for sales: | 206 938 0570 |
| Fax: | 206 938 1307 |
| Website: | www.Traders.com |
| E-mail address: | DPenn@traders.com |
Traders' Resource Links | |
| Charting the Stock Market: The Wyckoff Method -- Books | |
| Working-Money.com -- Online Trading Services | |
| Traders.com Advantage -- Online Trading Services | |
| Technical Analysis of Stocks & Commodities -- Publications and Newsletters | |
| Working Money, at Working-Money.com -- Publications and Newsletters | |
| Traders.com Advantage -- Publications and Newsletters | |
| Professional Traders Starter Kit -- Software | |
Click here for more information about our publications!
Comments
Date: 08/04/04Rank: 5Comment:

Request Information From Our Sponsors
- StockCharts.com, Inc.
- Candle Patterns
- Candlestick Charting Explained
- Intermarket Technical Analysis
- John Murphy on Chart Analysis
- John Murphy's Chart Pattern Recognition
- John Murphy's Market Message
- MurphyExplainsMarketAnalysis-Intermarket Analysis
- MurphyExplainsMarketAnalysis-Visual Analysis
- StockCharts.com
- Technical Analysis of the Financial Markets
- The Visual Investor
- VectorVest, Inc.
- Executive Premier Workshop
- One-Day Options Course
- OptionsPro
- Retirement Income Workshop
- Sure-Fire Trading Systems (VectorVest, Inc.)
- Trading as a Business Workshop
- VectorVest 7 EOD
- VectorVest 7 RealTime/IntraDay
- VectorVest AutoTester
- VectorVest Educational Services
- VectorVest OnLine
- VectorVest Options Analyzer
- VectorVest ProGraphics v6.0
- VectorVest ProTrader 7
- VectorVest RealTime Derby Tool
- VectorVest Simulator
- VectorVest Variator
- VectorVest Watchdog
