HOT TOPICS LIST
- MACD
- Fibonacci
- RSI
- Gann
- ADXR
- Stochastics
- Volume
- Triangles
- Futures
- Cycles
- Volatility
- ZIGZAG
- MESA
- Retracement
- Aroon
INDICATORS LIST
LIST OF TOPICS
PRINT THIS ARTICLE
by Arthur Hill
The Shanghai Composite has been a roller coaster over the last two years and is now approaching a major support zone.
Position: N/A
Arthur Hill
Arthur Hill is currently editor of TDTrader.com, a website specializing in trading strategies, sector/industry specific breadth stats and overall technical analysis. He passed the Society of Technical Analysts (STA London) diploma exam with distinction is a Certified Financial Technician (CFTe). Prior to TD Trader, he was the Chief Technical Analyst for Stockcharts.com and the main contributor to the ChartSchool.
PRINT THIS ARTICLE
BOLLINGER BANDS
Shanghai Composite Enters Support Zone
07/29/04 10:49:16 AMby Arthur Hill
The Shanghai Composite has been a roller coaster over the last two years and is now approaching a major support zone.
Position: N/A
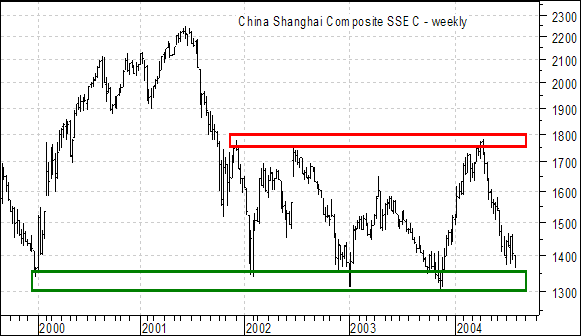
 Figure 1: Weekly chart of the Shanghai Composite. |
| Since deflating from above 2200 in Jun-01 to below 1400 in Feb-02, the Shanghai Composite ($SSEC) formed a large trading range over the last two and a half years. As can be expected from volatile securities, exact support and resistance levels are difficult to pinpoint and zones are preferable. The upper resistance zone (1750-1800) extends back to Dec-01 and the lower support zone (1300-1350) extends back to Dec-99. |

|
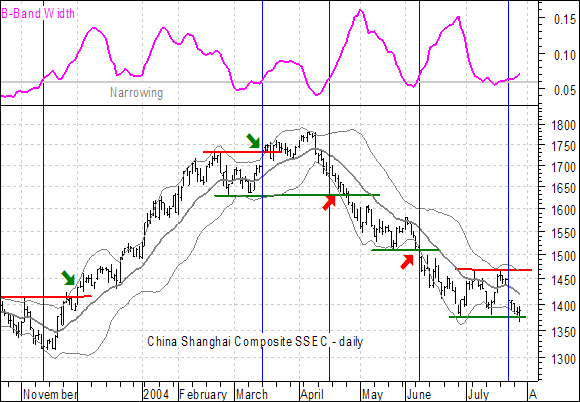
| Figure 2: Daily chart of the Shanghai Composite. |
| Graphic provided by: MetaStock. |
| |
| While weekly charts are great for perspective, it often helps to use a shorter time frame for timing. On the daily chart, the index is consolidating just above the support zone shown on the weekly chart. Bollinger Bands have been overlaid and the magenta indicator shows the Bollinger Band width as a percentage of the closing price. As the indicator shows, a narrowing of the bands (below .06) usually precedes a significant move. As the move occurs, the band will again widen (vertical blue lines). |
| Bollinger Bands do not have a directional bias and traders must turn to other methods for direction clues, such as support and resistance. Notice how the bands tightened in November and the resistance break resulted in a strong advance. The breakout in March was not a good signal, but the support breaks in April and June produced good moves. With the Bollinger Bands narrowing (below .06) in mid-July and now moving above .06, the odds of a move are increasing. Turning to support and resistance for directional confirmation, a close below 1370 would be bearish and a close above 1470 would be bullish. Note: Bollinger Band Width = (upper band - lower band) / closing price of the security |
Arthur Hill is currently editor of TDTrader.com, a website specializing in trading strategies, sector/industry specific breadth stats and overall technical analysis. He passed the Society of Technical Analysts (STA London) diploma exam with distinction is a Certified Financial Technician (CFTe). Prior to TD Trader, he was the Chief Technical Analyst for Stockcharts.com and the main contributor to the ChartSchool.
| Title: | Editor |
| Company: | TDTrader.com |
| Address: | Willem Geetsstraat 17 |
| Mechelen, B2800 | |
| Phone # for sales: | 3215345465 |
| Website: | www.tdtrader.com |
| E-mail address: | arthurh@tdtrader.com |
Traders' Resource Links | |
| TDTrader.com has not added any product or service information to TRADERS' RESOURCE. | |
Click here for more information about our publications!
Comments
Date: 07/30/04Rank: 2Comment:

Request Information From Our Sponsors
- StockCharts.com, Inc.
- Candle Patterns
- Candlestick Charting Explained
- Intermarket Technical Analysis
- John Murphy on Chart Analysis
- John Murphy's Chart Pattern Recognition
- John Murphy's Market Message
- MurphyExplainsMarketAnalysis-Intermarket Analysis
- MurphyExplainsMarketAnalysis-Visual Analysis
- StockCharts.com
- Technical Analysis of the Financial Markets
- The Visual Investor
- VectorVest, Inc.
- Executive Premier Workshop
- One-Day Options Course
- OptionsPro
- Retirement Income Workshop
- Sure-Fire Trading Systems (VectorVest, Inc.)
- Trading as a Business Workshop
- VectorVest 7 EOD
- VectorVest 7 RealTime/IntraDay
- VectorVest AutoTester
- VectorVest Educational Services
- VectorVest OnLine
- VectorVest Options Analyzer
- VectorVest ProGraphics v6.0
- VectorVest ProTrader 7
- VectorVest RealTime Derby Tool
- VectorVest Simulator
- VectorVest Variator
- VectorVest Watchdog
