HOT TOPICS LIST
- MACD
- Fibonacci
- RSI
- Gann
- ADXR
- Stochastics
- Volume
- Triangles
- Futures
- Cycles
- Volatility
- ZIGZAG
- MESA
- Retracement
- Aroon
INDICATORS LIST
LIST OF TOPICS
PRINT THIS ARTICLE
by Arthur Hill
DR Horton (DHI) is part of a homebuilding group that has outperformed the market over the last four years. With a head-and-shoulders reversal brewing, things could be about to change.
Position: Hold
Arthur Hill
Arthur Hill is currently editor of TDTrader.com, a website specializing in trading strategies, sector/industry specific breadth stats and overall technical analysis. He passed the Society of Technical Analysts (STA London) diploma exam with distinction is a Certified Financial Technician (CFTe). Prior to TD Trader, he was the Chief Technical Analyst for Stockcharts.com and the main contributor to the ChartSchool.
PRINT THIS ARTICLE
HEAD & SHOULDERS
DR Horton and the Head-and-Shoulders
07/28/04 10:16:28 AMby Arthur Hill
DR Horton (DHI) is part of a homebuilding group that has outperformed the market over the last four years. With a head-and-shoulders reversal brewing, things could be about to change.
Position: Hold
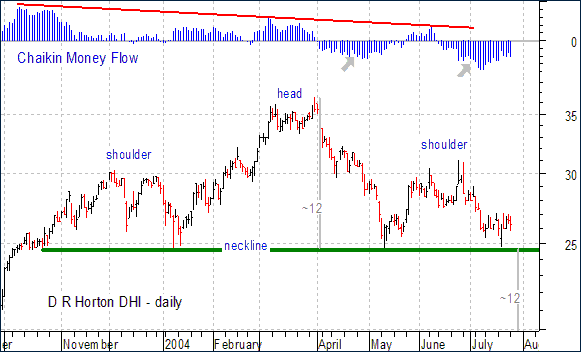
| Starting with the daily chart, we can focus on the head-and-shoulders pattern. The left shoulder formed from Nov-03 to Jan-04, the head in Mar-04 and the right shoulder from May-04 to Jul-04. The pattern is as picture perfect as they come with neckline support just below 25. |
| Money flow supports the head-and-shoulders. Chaikin Money Flow (20) peaked in Oct-03 and formed lower highs in March and June. These lower highs show diminished buying pressure on each advance. In addition, Chaikin Money Flow formed lower lows in April and July, which shows increased selling pressure. |

|
| Figure 1: Daily chart for DHI. |
| Graphic provided by: MetaStock. |
| |
| Despite a robust pattern and weak money flow, the head-and-shoulders has yet to be confirmed with a break below the May low at 24.63. As long as neckline support holds, the bulls still get the benefit of the doubt. A neckline break would project further weakness to around 13 (Note: The length of the pattern is subtracted from the neckline for a target). |
 Figure 2: Weekly chart for DHI. This target seems a bit extreme and the weekly chart shows support around 18. This area is confirmed by broken resistance (turned support) that extends back to Apr-02 and the trendline extending up from Oct-99. |
Arthur Hill is currently editor of TDTrader.com, a website specializing in trading strategies, sector/industry specific breadth stats and overall technical analysis. He passed the Society of Technical Analysts (STA London) diploma exam with distinction is a Certified Financial Technician (CFTe). Prior to TD Trader, he was the Chief Technical Analyst for Stockcharts.com and the main contributor to the ChartSchool.
| Title: | Editor |
| Company: | TDTrader.com |
| Address: | Willem Geetsstraat 17 |
| Mechelen, B2800 | |
| Phone # for sales: | 3215345465 |
| Website: | www.tdtrader.com |
| E-mail address: | arthurh@tdtrader.com |
Traders' Resource Links | |
| TDTrader.com has not added any product or service information to TRADERS' RESOURCE. | |
Click here for more information about our publications!
PRINT THIS ARTICLE

|

Request Information From Our Sponsors
- VectorVest, Inc.
- Executive Premier Workshop
- One-Day Options Course
- OptionsPro
- Retirement Income Workshop
- Sure-Fire Trading Systems (VectorVest, Inc.)
- Trading as a Business Workshop
- VectorVest 7 EOD
- VectorVest 7 RealTime/IntraDay
- VectorVest AutoTester
- VectorVest Educational Services
- VectorVest OnLine
- VectorVest Options Analyzer
- VectorVest ProGraphics v6.0
- VectorVest ProTrader 7
- VectorVest RealTime Derby Tool
- VectorVest Simulator
- VectorVest Variator
- VectorVest Watchdog
- StockCharts.com, Inc.
- Candle Patterns
- Candlestick Charting Explained
- Intermarket Technical Analysis
- John Murphy on Chart Analysis
- John Murphy's Chart Pattern Recognition
- John Murphy's Market Message
- MurphyExplainsMarketAnalysis-Intermarket Analysis
- MurphyExplainsMarketAnalysis-Visual Analysis
- StockCharts.com
- Technical Analysis of the Financial Markets
- The Visual Investor
