HOT TOPICS LIST
- MACD
- Fibonacci
- RSI
- Gann
- ADXR
- Stochastics
- Volume
- Triangles
- Futures
- Cycles
- Volatility
- ZIGZAG
- MESA
- Retracement
- Aroon
INDICATORS LIST
LIST OF TOPICS
PRINT THIS ARTICLE
by Arthur Hill
Despite weakness in the Nasdaq, Dell Inc. (DELL) remains within striking distance of its October high and shows good relative strength.
Position: Hold
Arthur Hill
Arthur Hill is currently editor of TDTrader.com, a website specializing in trading strategies, sector/industry specific breadth stats and overall technical analysis. He passed the Society of Technical Analysts (STA London) diploma exam with distinction is a Certified Financial Technician (CFTe). Prior to TD Trader, he was the Chief Technical Analyst for Stockcharts.com and the main contributor to the ChartSchool.
PRINT THIS ARTICLE
TECHNICAL ANALYSIS
DELL Continues to Hold Strong
07/28/04 01:50:50 PMby Arthur Hill
Despite weakness in the Nasdaq, Dell Inc. (DELL) remains within striking distance of its October high and shows good relative strength.
Position: Hold
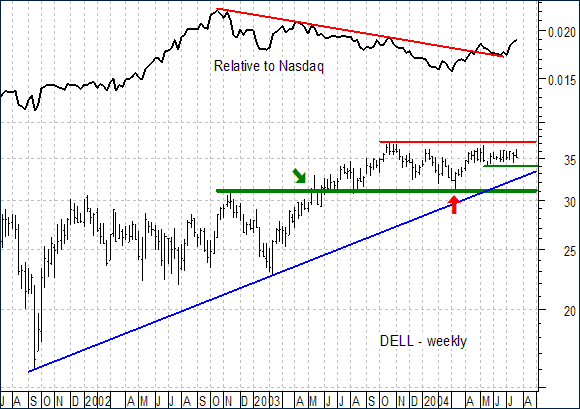
| Starting with the weekly chart, DELL broke above resistance at 31 in May 2003 (green arrow) and then began a long consolidation. Even though the stock has stalled over the last few months, it is has yet to actually breakdown and remains well above its March low (red arrow). |
| Looking at the price relative (DELL relative to the Nasdaq Composite), the stock has started outperforming over the last few months. The price relative broke above the red trendline extending down from Oct-02 and recorded a new high for 2004 just last week. Should the Nasdaq turn around, this strong relative performance suggests that DELL will lead. |

|
| Figure 1: Weekly chart for DELL. |
| Graphic provided by: MetaStock. |
| |
| Turning to the daily chart, the pattern since October looks like a large inverted head-and-shoulders pattern. This particular version is a bullish continuation pattern. Neckline resistance is a bit nebulous and more like a zone of resistance between 36.2 and 37.2. A move above this resistance zone would forge a 52-week high and argue for further strength into the low 40s. |
 Figure 2: Daily chart for DELL. An earlier signal can be had by focusing on the three month consolidation. The stock formed a triangle over the last few months (blue lines) as well as a tighter trading range over the last two months (magenta lines). A move above 36.2 would break both pennant and trading range resistance. However, a move below 34 would break pennant and trading range support. As an important component of the tech laden Nasdaq, the imminent break is likely to be felt throughout tech land. |
Arthur Hill is currently editor of TDTrader.com, a website specializing in trading strategies, sector/industry specific breadth stats and overall technical analysis. He passed the Society of Technical Analysts (STA London) diploma exam with distinction is a Certified Financial Technician (CFTe). Prior to TD Trader, he was the Chief Technical Analyst for Stockcharts.com and the main contributor to the ChartSchool.
| Title: | Editor |
| Company: | TDTrader.com |
| Address: | Willem Geetsstraat 17 |
| Mechelen, B2800 | |
| Phone # for sales: | 3215345465 |
| Website: | www.tdtrader.com |
| E-mail address: | arthurh@tdtrader.com |
Traders' Resource Links | |
| TDTrader.com has not added any product or service information to TRADERS' RESOURCE. | |
Click here for more information about our publications!
PRINT THIS ARTICLE

Request Information From Our Sponsors
- StockCharts.com, Inc.
- Candle Patterns
- Candlestick Charting Explained
- Intermarket Technical Analysis
- John Murphy on Chart Analysis
- John Murphy's Chart Pattern Recognition
- John Murphy's Market Message
- MurphyExplainsMarketAnalysis-Intermarket Analysis
- MurphyExplainsMarketAnalysis-Visual Analysis
- StockCharts.com
- Technical Analysis of the Financial Markets
- The Visual Investor
- VectorVest, Inc.
- Executive Premier Workshop
- One-Day Options Course
- OptionsPro
- Retirement Income Workshop
- Sure-Fire Trading Systems (VectorVest, Inc.)
- Trading as a Business Workshop
- VectorVest 7 EOD
- VectorVest 7 RealTime/IntraDay
- VectorVest AutoTester
- VectorVest Educational Services
- VectorVest OnLine
- VectorVest Options Analyzer
- VectorVest ProGraphics v6.0
- VectorVest ProTrader 7
- VectorVest RealTime Derby Tool
- VectorVest Simulator
- VectorVest Variator
- VectorVest Watchdog
