HOT TOPICS LIST
- MACD
- Fibonacci
- RSI
- Gann
- ADXR
- Stochastics
- Volume
- Triangles
- Futures
- Cycles
- Volatility
- ZIGZAG
- MESA
- Retracement
- Aroon
INDICATORS LIST
LIST OF TOPICS
PRINT THIS ARTICLE
by David Penn
Ending diagonal triangles are one of the many ways Elliott wave analysts bring five-wave movements to a close.
Position: N/A
David Penn
Technical Writer for Technical Analysis of STOCKS & COMMODITIES magazine, Working-Money.com, and Traders.com Advantage.
PRINT THIS ARTICLE
TRIANGLES
Journey to the End of the Diagonal
07/29/04 10:06:30 AMby David Penn
Ending diagonal triangles are one of the many ways Elliott wave analysts bring five-wave movements to a close.
Position: N/A
| In my last Elliott wave-oriented article, I suggested that a "third of a third" might be around the corner ("Third of a Third?" Traders.com Advantage, June 23, 2004). In Elliott wave parlance, a third of a third is the most volatile, robust and potentially-lucrative part of a five wave impulse move--a sort of best of the best that every Elliott wave trader looks and longs for when scanning market charts. |
| In that article, I suggested a market top with the peak on June 8th. This top was a wave two, a "bear market rally" that retraced a significant chunk of the previous wave one declines. As it turned out, the actual peak was a few days away, as the market climbed a bit higher toward the end of the month. Thus, I would now revise my count to make the wave two peak appear on June 24th. |

|
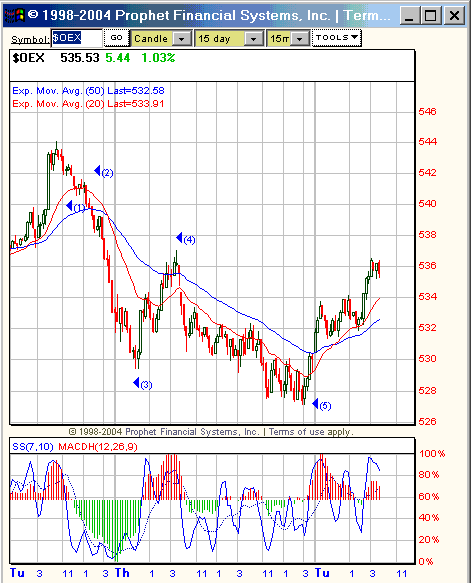
| Figure 1: This five-wave sequence forms wave five. |
| Graphic provided by: Prophet Financial Systems, Inc. |
| |
| Wave three, then lasted from June 24th to July 19th. In terms of the $OEX, or the S&P 100, this meant a decline from about 558 to 534, a drop of about 4%. Wave four saw the $OEX rally back up to 544 in a fairly sharp, two-day rally. And wave five began immediately thereafter. It is within this last wave five that I spotted an ending diagonal triangle. |
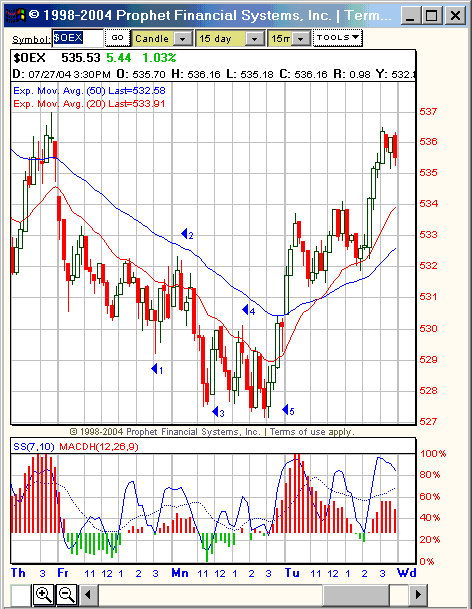
 Figure 2. The ending diagonal triangle on July 22-26 set the stage for the sharp, counter-trend rally on the 27th. Triangles in general and diagonal triangles in specific have long been a part of technical analysis. In Elliott wave analysis, the diagonal triangle--which looks much like a declining wedge a la traditional technical analysis--are actually "impulsive" rather than "corrective". This means, crudely put, that they are pro-trend as opposed to counter-trend. Diagonal triangles, as impulse patterns, have five legs or five waves. Unlike most impulse patterns, the first and fourth waves in a diagonal triangle can and do overlap. Another interesting difference is that whereas third waves are generally the largest in corrective triangles and in most other impulse patterns, ending diagonals feature an initial wave that is the longest and a fifth and final wave that is the shortest (caveat: contracting triangles are one corrective form in which the first wave is the longest). |
| This, as all Elliott wave counts, is my best judgment of the wave count thus far. In the wake of the ending diagonal triangle, there has been a counter-trend rally that has brought prices back to levels comparable to the wave four high immediately before the ending diagonal began. On hourly charts, the Tuesday, July 27th rally looks overbought already, with a 7,10 stochastic that has hooked down. Nearest resistance is at the level of the previous wave four high at about 537, and serious technical damage to this wave count would occur if prices moved meaningfully above the level of the wave four peak of one higher degree at 544. If the $OEX does not rally to these levels and, in fact, reverses and takes out the low at 528, then it will be quite likely that the third wave of the movement from the July 21st high will be underway. My immediate downside target in this event is 502, based on Fischer's Elliott wave/Fibonacci method (methodology explained in Fischer's "Fibonacci Applications and Strategies for Traders"). |
Technical Writer for Technical Analysis of STOCKS & COMMODITIES magazine, Working-Money.com, and Traders.com Advantage.
| Title: | Technical Writer |
| Company: | Technical Analysis, Inc. |
| Address: | 4757 California Avenue SW |
| Seattle, WA 98116 | |
| Phone # for sales: | 206 938 0570 |
| Fax: | 206 938 1307 |
| Website: | www.Traders.com |
| E-mail address: | DPenn@traders.com |
Traders' Resource Links | |
| Charting the Stock Market: The Wyckoff Method -- Books | |
| Working-Money.com -- Online Trading Services | |
| Traders.com Advantage -- Online Trading Services | |
| Technical Analysis of Stocks & Commodities -- Publications and Newsletters | |
| Working Money, at Working-Money.com -- Publications and Newsletters | |
| Traders.com Advantage -- Publications and Newsletters | |
| Professional Traders Starter Kit -- Software | |
Click here for more information about our publications!
Comments
Date: 07/29/04Rank: 5Comment:
Date: 07/30/04Rank: 1Comment:

|

Request Information From Our Sponsors
- StockCharts.com, Inc.
- Candle Patterns
- Candlestick Charting Explained
- Intermarket Technical Analysis
- John Murphy on Chart Analysis
- John Murphy's Chart Pattern Recognition
- John Murphy's Market Message
- MurphyExplainsMarketAnalysis-Intermarket Analysis
- MurphyExplainsMarketAnalysis-Visual Analysis
- StockCharts.com
- Technical Analysis of the Financial Markets
- The Visual Investor
- VectorVest, Inc.
- Executive Premier Workshop
- One-Day Options Course
- OptionsPro
- Retirement Income Workshop
- Sure-Fire Trading Systems (VectorVest, Inc.)
- Trading as a Business Workshop
- VectorVest 7 EOD
- VectorVest 7 RealTime/IntraDay
- VectorVest AutoTester
- VectorVest Educational Services
- VectorVest OnLine
- VectorVest Options Analyzer
- VectorVest ProGraphics v6.0
- VectorVest ProTrader 7
- VectorVest RealTime Derby Tool
- VectorVest Simulator
- VectorVest Variator
- VectorVest Watchdog
